


Our team has over 7,000,000 traders!
Every day we work together to improve trading. We get high results and move forward.
Recognition by millions of traders all over the world is the best appreciation of our work! You made your choice and we will do everything it takes to meet your expectations!
We are a great team together!
InstaSpot. Proud to work for you!


Actor, UFC 6 tournament champion and a true hero!
The man who made himself. The man that goes our way.
The secret behind Taktarov's success is constant movement towards the goal.
Reveal all the sides of your talent!
Discover, try, fail - but never stop!
InstaSpot. Your success story starts here!

On the daily chart, both the price and the Marlin oscillator are forming triangles. If it weren't for the downward pressure from the MACD line, the trend would likely be predominantly bullish. However, given the current circumstances, the probability of the trend remains uncertain.
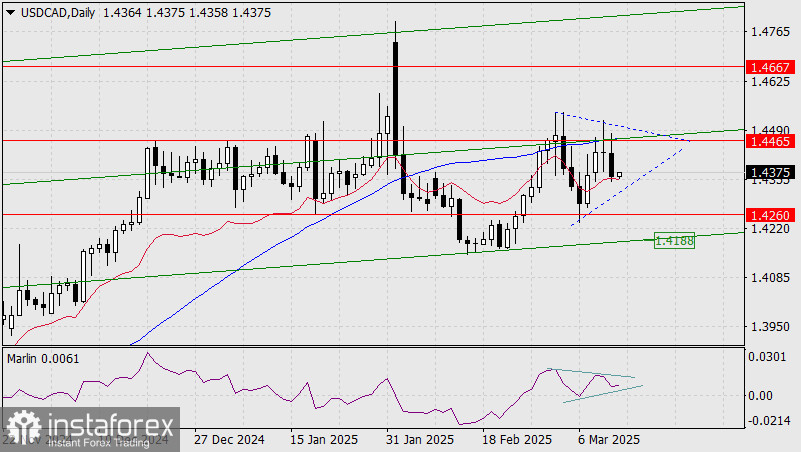
It can be inferred that this triangle represents a sideways trend within the 1.4260 to 1.4465 range. If the market gains enough strength to initiate an upward movement, a key signal would be a consolidation above the 1.4465 level.
A downward movement is more complex. For a decline to take place, the price must break not only the 1.4260 support level but also the embedded green price channel line, which is around the 1.4188 mark.
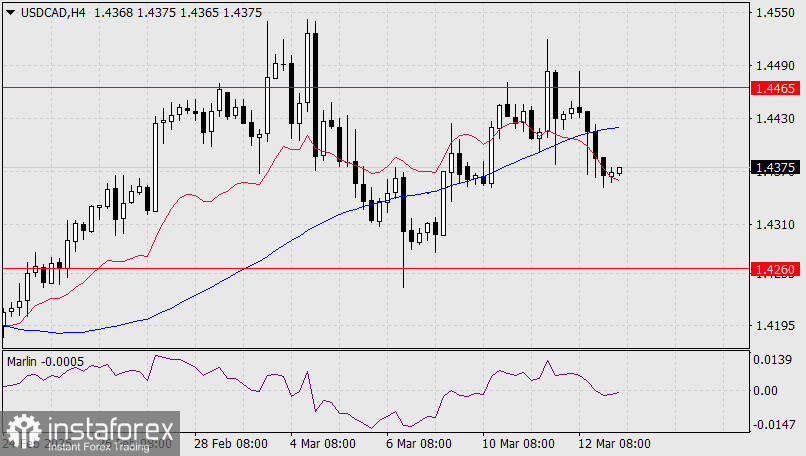
On the four-hour chart, the price is positioned below the MACD line but remains above the balance line, indicating that the current decline is corrective. The Marlin oscillator is hovering near the zero line, which also suggests an uncertain situation. As it stands, we need to wait for a natural resolution of this indecisiveness within the sideways trend.
*The market analysis posted here is meant to increase your awareness, but not to give instructions to make a trade.
InstaSpot analytical reviews will make you fully aware of market trends! Being an InstaSpot client, you are provided with a large number of free services for efficient trading.


