


The legend in the InstaSpot team!
Legend! You think that's bombastic rhetoric? But how should we call a man, who became the first Asian to win the junior world chess championship at 18 and who became the first Indian Grandmaster at 19? That was the start of a hard path to the World Champion title for Viswanathan Anand, the man who became a part of history of chess forever. Now one more legend in the InstaSpot team!


Borussia is one of the most titled football clubs in Germany, which has repeatedly proved to fans: the spirit of competition and leadership will certainly lead to success. Trade in the same way that sports professionals play the game: confidently and actively. Keep a "pass" from Borussia FC and be in the lead with InstaSpot!

EUR/USD
Higher timeframes
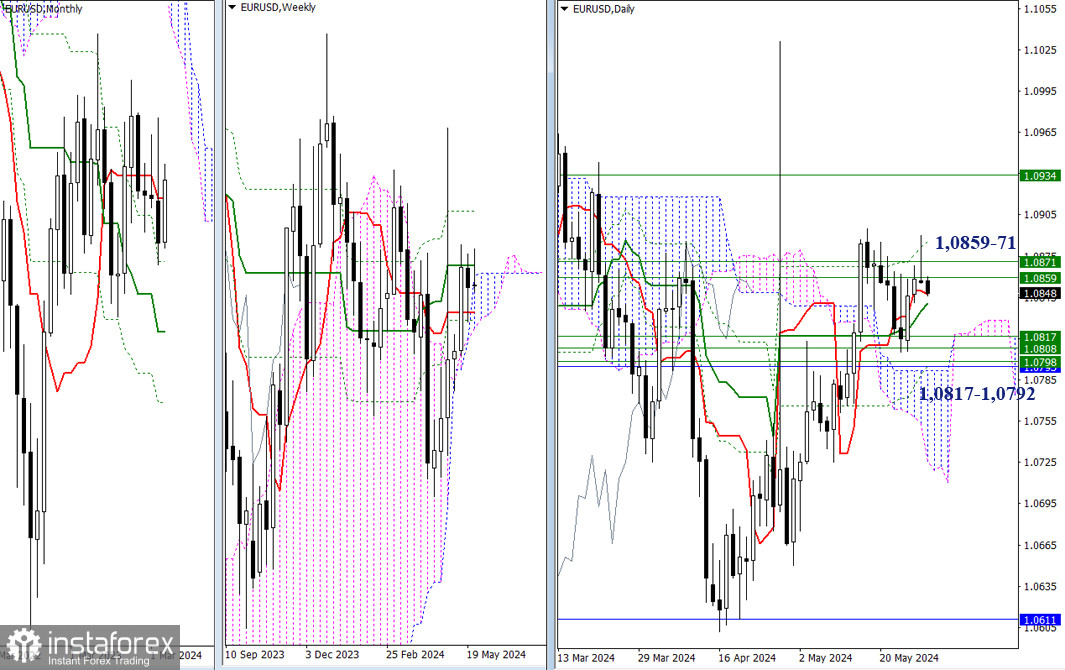
The bulls faced yet another setback. Yesterday, they failed to update the pair's high (1.0895) and move beyond the weekly resistances (1.0859 - 1.0871). As a result, EUR/USD bounced downwards. To confirm and work on this today, it is necessary to overcome the influence of the main levels of the daily cross at 1.0848 - 1.0840 (Tenkan + Kijun). After this, the next challenge will be interacting with a solid support area, which includes several strong levels from higher timeframes within a narrow range (1.0817 - 1.0792).
H4 – H1
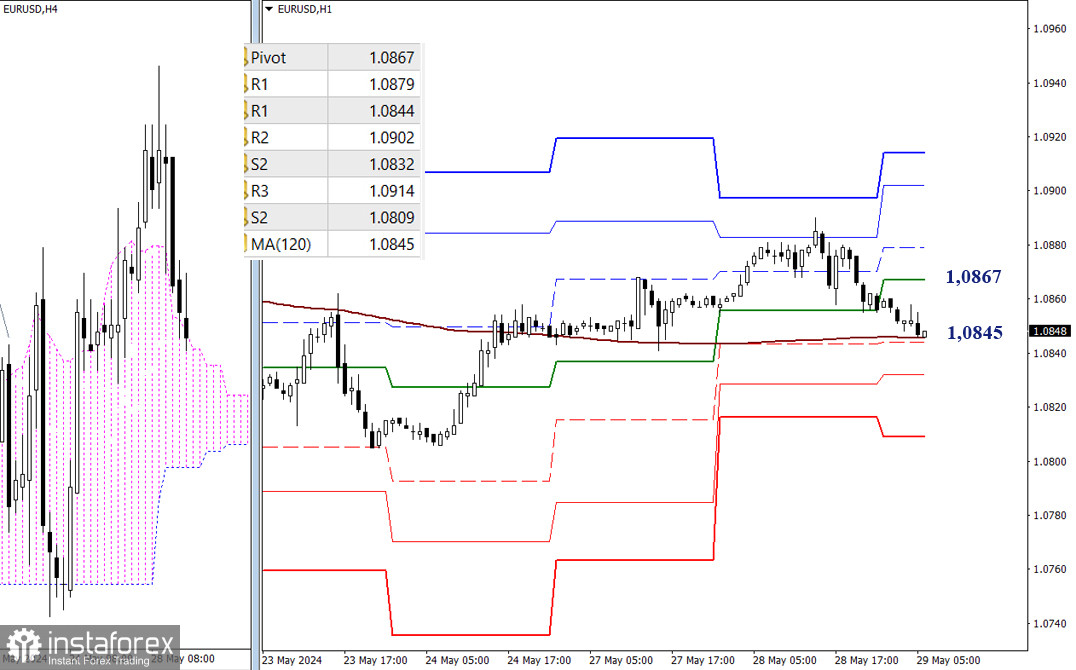
On the lower timeframes, the bearish correction has led to a test of the weekly long-term trend (1.0845). Breaking through this level could change the current balance of power. The next bearish targets after the intraday break will be the classic Pivot levels (1.0844 - 1.0832 - 1.0809). In case of a rebound from the weekly long-term trend, the focus will shift to recovering lost positions, and the market will concentrate on the resistance levels of the classic Pivot points. Currently, these resistances are located at 1.0867 - 1.0879 - 1.0902 - 1.0914.
***
Higher Timeframes
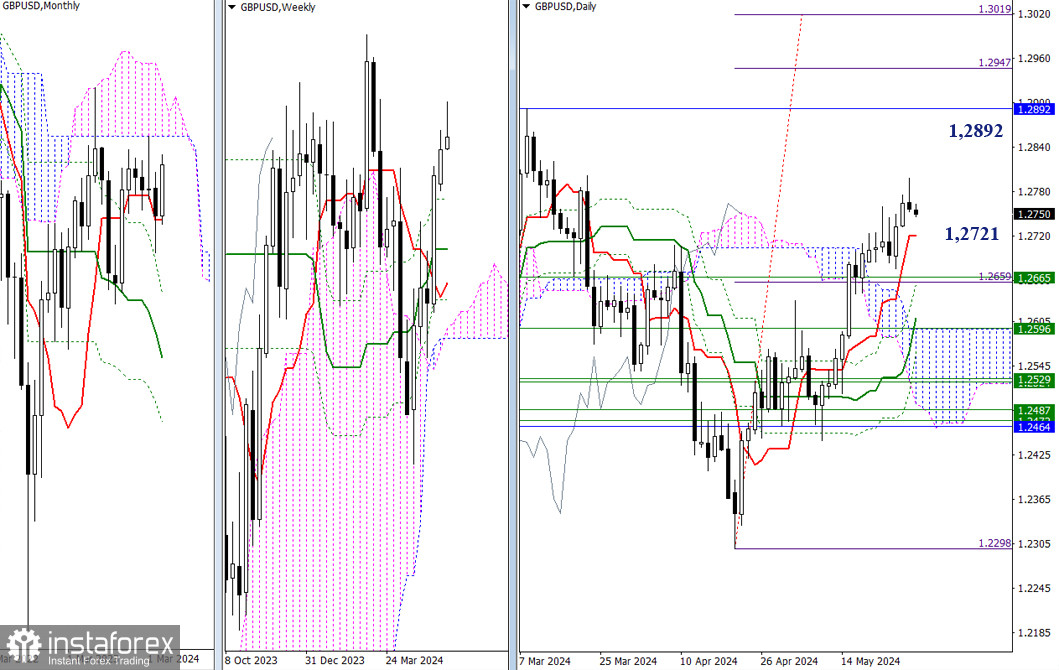
Yesterday, the bulls ended the day with the price gradually moving downwards. If it continues to decline, the market will encounter support levels at 1.2721 (daily short-term trend) and 1.2665 (weekly Fibo Kijun). However, if the bears fail to change the situation and the bulls overcome the slowdown, GBP/USD could rise, with bullish targets at 1.2892 (lower boundary of the monthly cloud) and 1.2947 – 1.3019 (daily target for breaking the cloud).
H4 – H1
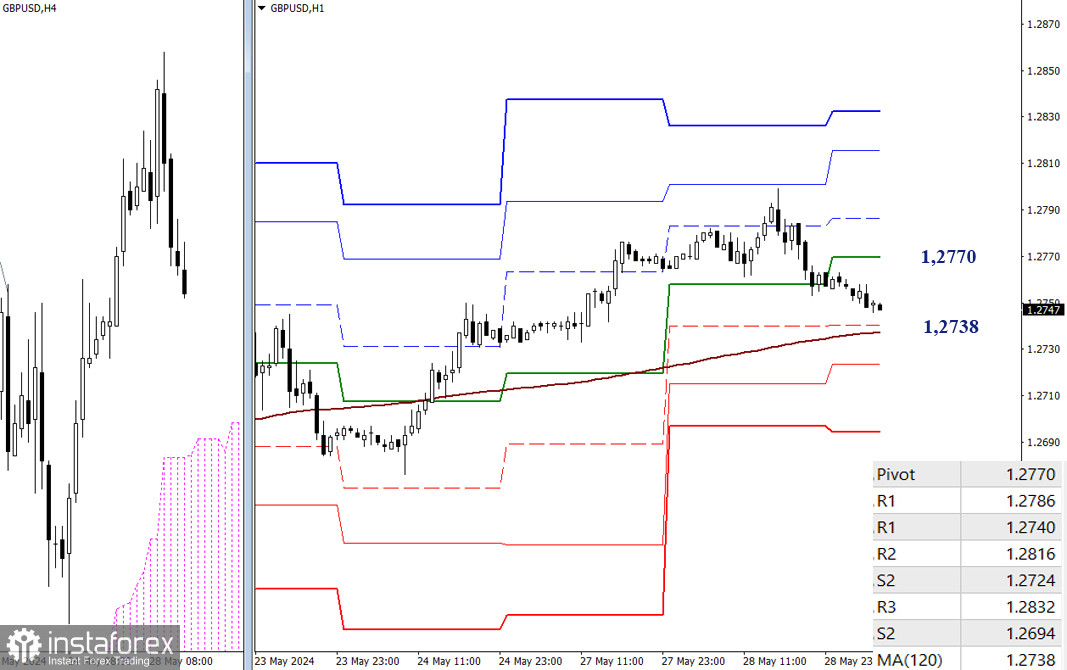
A correction is currently developing on the lower timeframes. The market is approaching a key level – the weekly long-term trend at 1.2738, which determines the current balance of power. Its outcome could set the course for further development. A rebound would shift the focus to the resistance levels of the classic Pivot points, which are located at 1.2770, 1.2786, 1.2816, and 1.2832. Conversely, a breakthrough would place the focus on the support levels of the classic Pivot points at 1.2724 and 1.2694.
***
The technical analysis of the situation uses:
Higher timeframes - Ichimoku Kinko Hyo (9.26.52) + Fibonacci Kijun levels
Lower timeframes - H1 - Pivot Points (classic) + Moving Average 120 (weekly long-term trend)
*The market analysis posted here is meant to increase your awareness, but not to give instructions to make a trade.
InstaSpot analytical reviews will make you fully aware of market trends! Being an InstaSpot client, you are provided with a large number of free services for efficient trading.


