


The legend in the InstaSpot team!
Legend! You think that's bombastic rhetoric? But how should we call a man, who became the first Asian to win the junior world chess championship at 18 and who became the first Indian Grandmaster at 19? That was the start of a hard path to the World Champion title for Viswanathan Anand, the man who became a part of history of chess forever. Now one more legend in the InstaSpot team!


Borussia is one of the most titled football clubs in Germany, which has repeatedly proved to fans: the spirit of competition and leadership will certainly lead to success. Trade in the same way that sports professionals play the game: confidently and actively. Keep a "pass" from Borussia FC and be in the lead with InstaSpot!

GBP/USD also continued to trade higher on Tuesday. Yesterday, the UK published three reports that were quite interesting. The unemployment rate, if not dismal, turned out to be worse than forecasts. However, the level of unemployment claims and wage levels supported the British pound. Wages showed a higher growth rate than expected, which could negatively impact the inflation indicator. The British pound initially fell, clearly reacting to the poor unemployment figures. The US Producer Price Index was released in the second half of the day, and it pushed the GBP/USD pair to rise. Although it would have been more logical to see the pair fall due to this report.
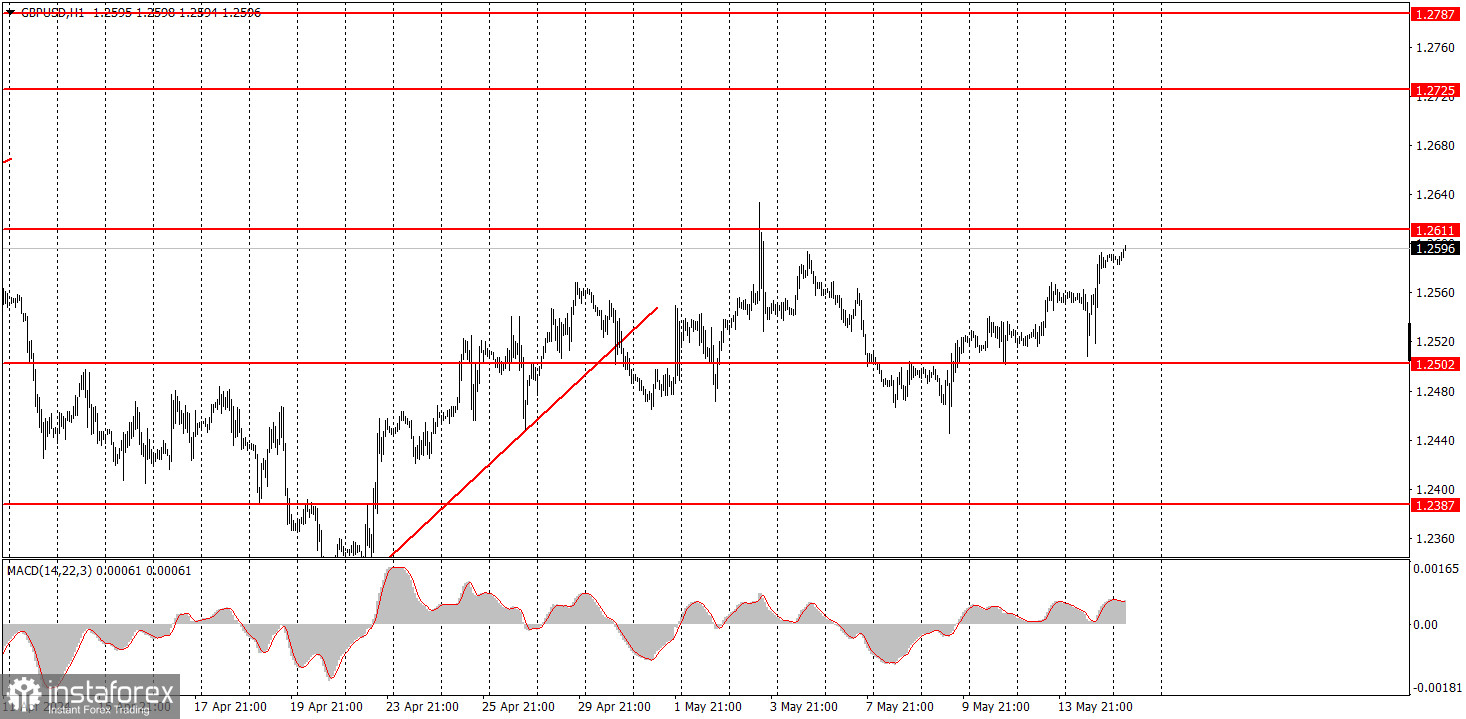
Overall, the pound continues to rise towards the target of 1.2611, which can be considered the upper boundary of the new sideways channel. We deliberately reduced the scale of the chart so that traders could visually confirm the presence of a new flat pattern. Until the price consolidates above 1.2611, the flat pattern will remain intact.
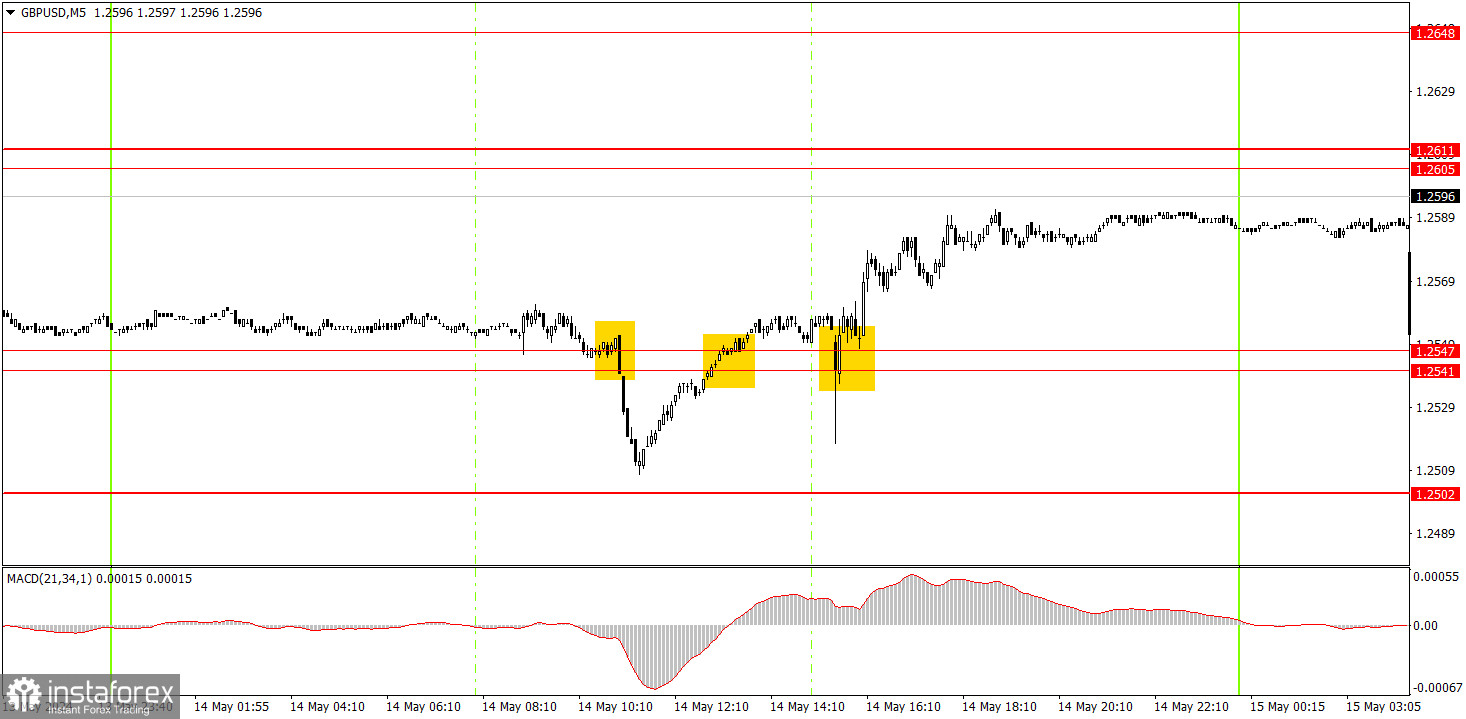
The 5-minute timeframe showed that macro data was more of a hindrance. But at the same time, we saw more or less volatility thanks to these reports. The first sell signal was formed in the area of 1.2541-1.2547. The price fell short of hitting the target level by just a few pips. Then two buy signals were formed in the same area, which duplicated each other. Therefore, traders should have only opened one long position. By the end of the day, the pair gained 30 pips, which novice traders could get by closing the deal manually. It is also possible to wait for the pound to reach the level of 1.2605.
On the hourly chart, the GBP/USD pair has great prospects for forming a downward trend, but the correction remains intact. The fundamental backdrop continues to support the dollar much more than the British pound. Therefore, we only expect downward movement from the pair. The economic reports hardly support the pound, but the market interprets almost all of the news in favor of the British currency.
If we are talking about logical movements, then we expect the pound to fall on Wednesday. However, overcoming the 1.2541-1.2547 area allows beginners to hold on to long positions for some time with 1.2605-1.2611 as the target. Traders may consider short positions when the price bounces from the 1.2605-1.2611 area.
The key levels on the 5M chart are 1.2270, 1.2310, 1.2372-1.2387, 1.2457, 1.2502, 1.2541-1.2547, 1.2605-1.2611, 1.2648, 1.2691, 1.2725, 1.2787-1.2791. On Wednesday, there are no major events scheduled in the UK, while the US will release a crucial inflation report for April. Therefore, we expect the price to "fly" in different directions during the US session.
1) Signal strength is determined by the time taken for its formation (either a bounce or level breach). A shorter formation time indicates a stronger signal.
2) If two or more trades around a certain level are initiated based on false signals, subsequent signals from that level should be disregarded.
3) In a flat market, any currency pair can produce multiple false signals or none at all. In any case, the flat trend is not the best condition for trading.
4) Trading activities are confined between the onset of the European session and mid-way through the U.S. session, after which all open trades should be manually closed.
5) On the 30-minute timeframe, trades based on MACD signals are only advisable amidst substantial volatility and an established trend, confirmed either by a trendline or trend channel.
6) If two levels lie closely together (ranging from 5 to 15 pips apart), they should be considered as a support or resistance zone.
Support and Resistance price levels can serve as targets when buying or selling. You can place Take Profit levels near them.
Red lines represent channels or trend lines, depicting the current market trend and indicating the preferable trading direction.
The MACD(14,22,3) indicator, encompassing both the histogram and signal line, acts as an auxiliary tool and can also be used as a signal source.
Significant speeches and reports (always noted in the news calendar) can profoundly influence the price dynamics. Hence, trading during their release calls for heightened caution. It may be reasonable to exit the market to prevent abrupt price reversals against the prevailing trend.
Beginners should always remember that not every trade will yield profit. Establishing a clear strategy coupled with sound money management is the cornerstone of sustained trading success.
*The market analysis posted here is meant to increase your awareness, but not to give instructions to make a trade.
InstaSpot analytical reviews will make you fully aware of market trends! Being an InstaSpot client, you are provided with a large number of free services for efficient trading.


