


The legend in the InstaSpot team!
Legend! You think that's bombastic rhetoric? But how should we call a man, who became the first Asian to win the junior world chess championship at 18 and who became the first Indian Grandmaster at 19? That was the start of a hard path to the World Champion title for Viswanathan Anand, the man who became a part of history of chess forever. Now one more legend in the InstaSpot team!


Borussia is one of the most titled football clubs in Germany, which has repeatedly proved to fans: the spirit of competition and leadership will certainly lead to success. Trade in the same way that sports professionals play the game: confidently and actively. Keep a "pass" from Borussia FC and be in the lead with InstaSpot!

EUR/USD resumed its upward movement on Thursday and once again it was near the upper boundary of the channel. Thus, the bullish correction persists. Yesterday, the euro could have strengthened due to the Bank of England meeting, as there was no other news during the day. However, we don't consider this a hawkish meeting. BoE Governor Andrew Bailey discussed the prospects of monetary policy easing, and this time two members of the Monetary Policy Committee voted for a rate cut. Therefore, it would have been more logical to see the pound fall, followed by the euro. But in reality, we saw another illogical rise, and the pound pulled the euro with it.
In addition, it's worth taking note of the US unemployment claims report, which showed that initial claims for state unemployment benefits increased more than expected. This report is not crucial, but it could have "hit" the dollar on Thursday.
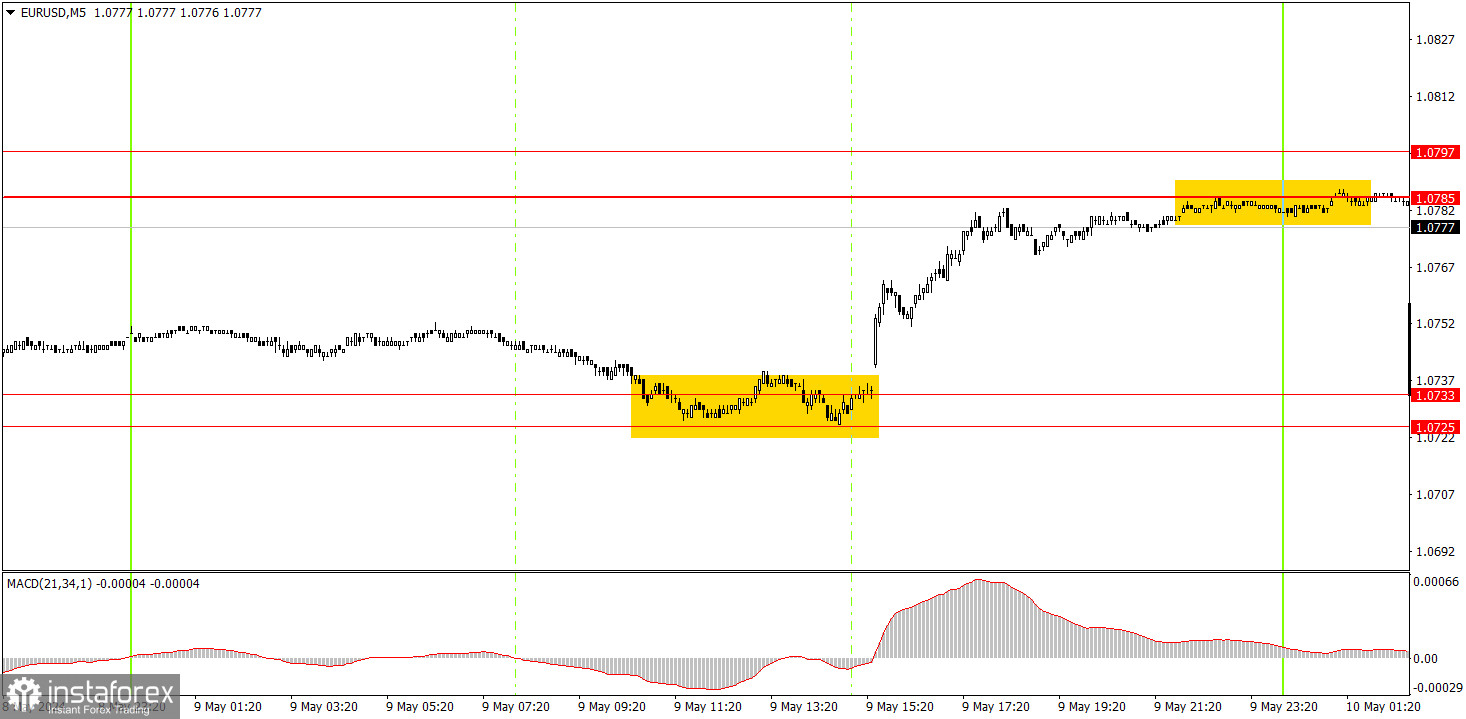
On the 5-minute timeframe, a good buy signal was formed around the area of 1.0725-1.0733, but it was quite difficult to catch it in time. The price moved away from this area exactly at the moment when the results of the BoE's meeting were announced, so the pair rapidly began to rise. However, it was still possible to open a trade in time. By the end of the day, the price hit the nearest target level at 1.0785. The profit amounted to about 30 pips.
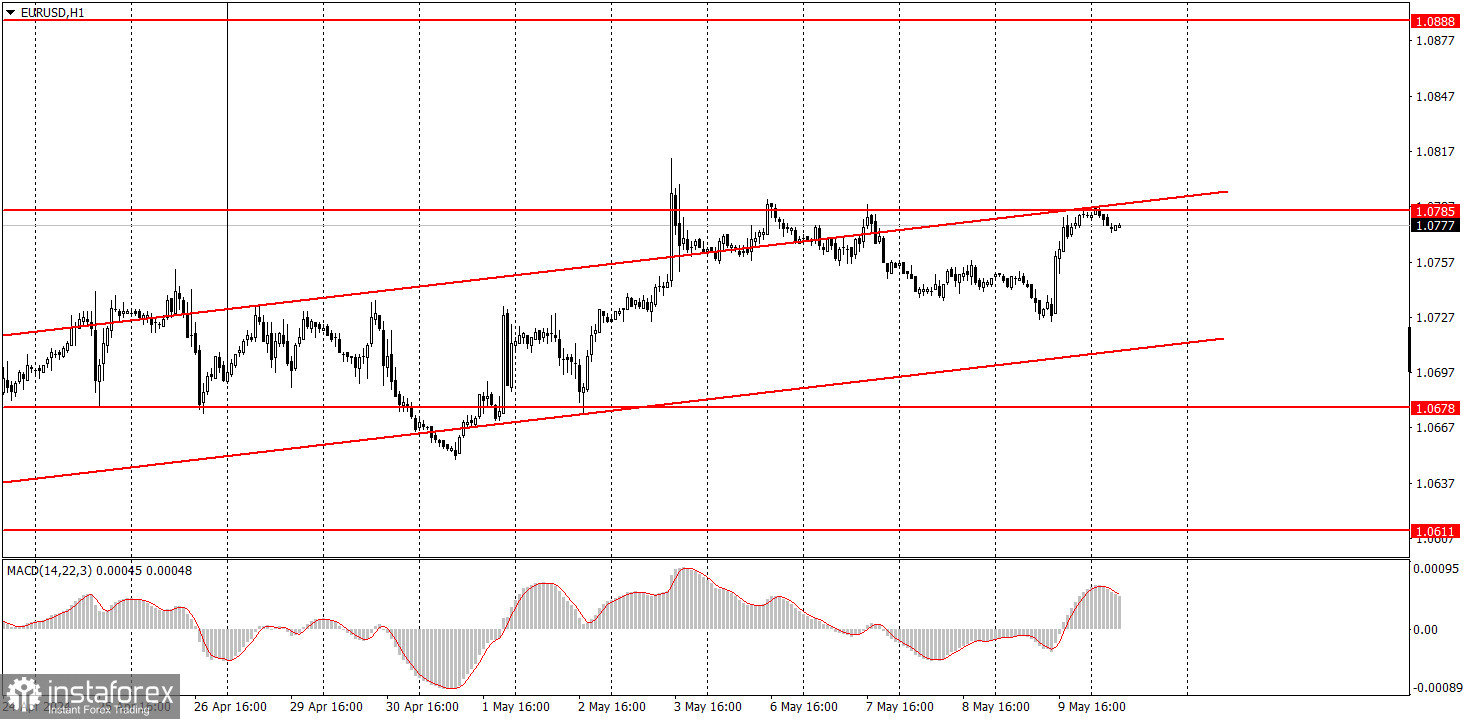
On the hourly chart, the EUR/USD pair continues to go through a corrective phase. We believe that the decline should resume in the medium term, as the euro remains expensive, and in general, the global trend is pointing downwards. The fundamental background still supports the US dollar, and the recent FOMC meeting proved this - now Federal Reserve Chair Jerome Powell doesn't even know when monetary policy easing will begin.
On Friday, we advise novice traders to closely monitor the area between 1.0785-1.0797. Traders may consider selling the pair if the price rebounds from this area, after that they can aim for 1.0725-1.0733. A breakthrough will allow traders to consider buying with 1.0838-1.0856 as the target.
The key levels on the 5M chart are 1.0483, 1.0526, 1.0568, 1.0611, 1.0678, 1.0725-1.0733, 1.0785-1.0797, 1.0838-1.0856, 1.0888-1.0896, 1.0940, 1.0971-1.0981. Today, there are no important events scheduled in the European Union, and the US docket will only feature the University of Michigan Consumer Sentiment Index. Therefore, the pair may show weak movements, close to a flat.
1) Signal strength is determined by the time taken for its formation (either a bounce or level breach). A shorter formation time indicates a stronger signal.
2) If two or more trades around a certain level are initiated based on false signals, subsequent signals from that level should be disregarded.
3) In a flat market, any currency pair can produce multiple false signals or none at all. In any case, the flat trend is not the best condition for trading.
4) Trading activities are confined between the onset of the European session and mid-way through the U.S. session, after which all open trades should be manually closed.
5) On the 30-minute timeframe, trades based on MACD signals are only advisable amidst substantial volatility and an established trend, confirmed either by a trendline or trend channel.
6) If two levels lie closely together (ranging from 5 to 15 pips apart), they should be considered as a support or resistance zone.
Support and Resistance price levels can serve as targets when buying or selling. You can place Take Profit levels near them.
Red lines represent channels or trend lines, depicting the current market trend and indicating the preferable trading direction.
The MACD(14,22,3) indicator, encompassing both the histogram and signal line, acts as an auxiliary tool and can also be used as a signal source.
Significant speeches and reports (always noted in the news calendar) can profoundly influence the price dynamics. Hence, trading during their release calls for heightened caution. It may be reasonable to exit the market to prevent abrupt price reversals against the prevailing trend.
Beginning traders should always remember that not every trade will yield profit. Establishing a clear strategy coupled with sound money management is the cornerstone of sustained trading success.
*The market analysis posted here is meant to increase your awareness, but not to give instructions to make a trade.
InstaSpot analytical reviews will make you fully aware of market trends! Being an InstaSpot client, you are provided with a large number of free services for efficient trading.


