


Our team has over 7,000,000 traders!
Every day we work together to improve trading. We get high results and move forward.
Recognition by millions of traders all over the world is the best appreciation of our work! You made your choice and we will do everything it takes to meet your expectations!
We are a great team together!
InstaSpot. Proud to work for you!


Actor, UFC 6 tournament champion and a true hero!
The man who made himself. The man that goes our way.
The secret behind Taktarov's success is constant movement towards the goal.
Reveal all the sides of your talent!
Discover, try, fail - but never stop!
InstaSpot. Your success story starts here!

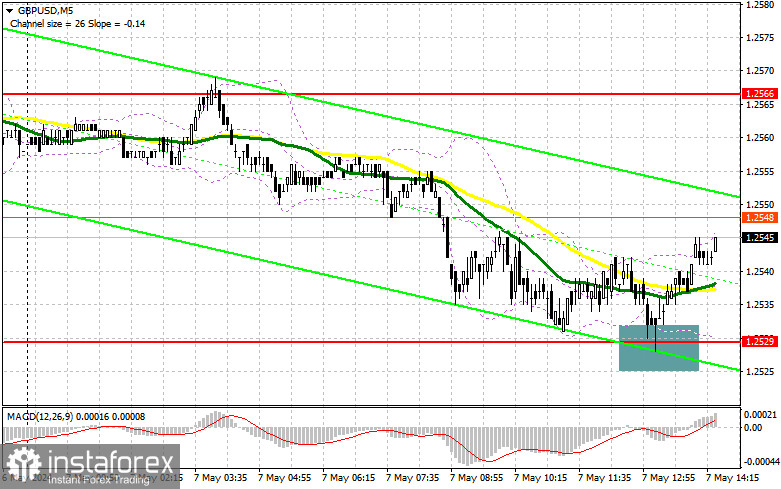
In my morning forecast, I paid attention to the level of 1.2529 and planned to make decisions on market entry based on it. Let's look at the 5-minute chart and analyze what happened there. The decline and the formation of a false breakout led to an excellent entry point for buying the pound. At the time of writing this article, the growth amounted to about 15 points, and that was all. However, as long as trading stays above 1.2529, the chances for further growth remain. The technical picture for the second half of the day still needs to be revised.
For opening long positions on GBP/USD, the following is required:
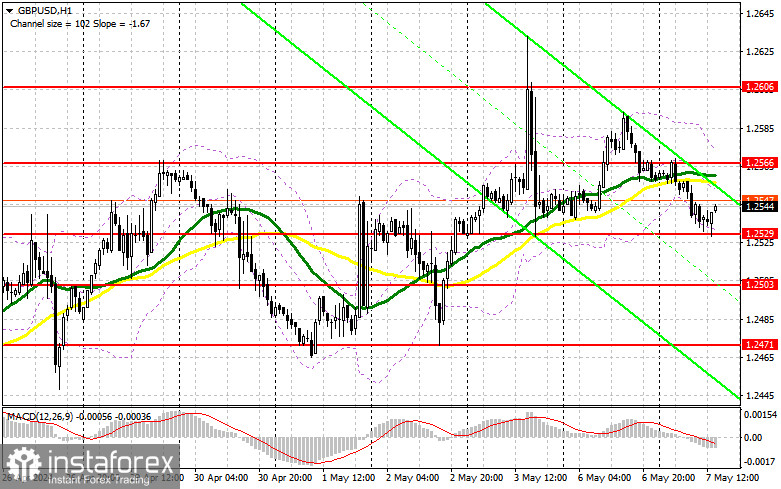
Considering the quite decent data on the growth of activity in the UK construction sector, pound buyers managed to show themselves around 1.2529, but they need help figuring out what to do next. It is unlikely to become clearer in the second half of the day after the release of data on the RCM/TIPP Economic Optimism Index and the volume of consumer credit in the US. These figures do not mean much, so the pair may continue trading within a narrow sideways channel and its lower boundary of 1.2529. Another false breakout formation there, similar to what I analyzed earlier, will provide an entry point for buying with the goal of returning to the resistance at 1.2566, where the moving averages, playing on the sellers' side, are located. Breaking and testing this range from top to bottom against the backdrop of poor statistics is a chance for GBP/USD to rise with an update to 1.2606. If we break above this range, we can talk about a surge to 1.2657, where I plan to make a profit. In the scenario of a decline in GBP/USD and the absence of buyers at 1.2529 in the second half of the day, pressure on the pound will increase, and a further upward trend will be at risk. In such a case, I will look for purchases around 1.2503. The formation of a false breakout will be a suitable option for market entry. I plan to open long positions on GBP/USD immediately on the rebound from 1.2467, with a target of a correction of 30-35 points within the day.
For opening short positions on GBP/USD, the following is required:
Bears have a good chance to continue the pair's decline, but for this, strong US statistics and statements from Fed officials about further combating high inflation are needed. The formation of a false breakout around 1.2566 would be an ideal condition for entering short positions, leading to a decline in GBP/USD to around 1.2529. Bulls may not withstand a second hit to this level, so breaking and reverse testing from the bottom to the top of this range will increase pressure on the pair, giving bears an advantage and another entry point for selling with the goal of updating to 1.2503. Testing this level will put buyers in a very precarious position. The ultimate target will be a minimum of 1.2467, where I will take profit. In the scenario of GBP/USD rise and the absence of bears at 1.2566 in the second half of the day, bulls will have the opportunity to update the maximum at 1.2606. I will only enter there on a false breakout. In the absence of activity there, I recommend opening short positions on GBP/USD from 1.2657, expecting a rebound of the pair down by 30-35 points within the day.
Indicator signals:
Moving averages
Trading is conducted below the 30 and 50-day moving averages, indicating a further decline of the pound.
Note: The period and prices of moving averages considered by the author are on the H1 hourly chart and differ from the general definition of classical daily moving averages on the D1 daily chart.
Bollinger Bands
In case of a decrease, the lower boundary of the indicator, around 1.2529, will act as support.
Description of indicators
*The market analysis posted here is meant to increase your awareness, but not to give instructions to make a trade.
InstaSpot analytical reviews will make you fully aware of market trends! Being an InstaSpot client, you are provided with a large number of free services for efficient trading.


