


The legend in the InstaSpot team!
Legend! You think that's bombastic rhetoric? But how should we call a man, who became the first Asian to win the junior world chess championship at 18 and who became the first Indian Grandmaster at 19? That was the start of a hard path to the World Champion title for Viswanathan Anand, the man who became a part of history of chess forever. Now one more legend in the InstaSpot team!


Borussia is one of the most titled football clubs in Germany, which has repeatedly proved to fans: the spirit of competition and leadership will certainly lead to success. Trade in the same way that sports professionals play the game: confidently and actively. Keep a "pass" from Borussia FC and be in the lead with InstaSpot!

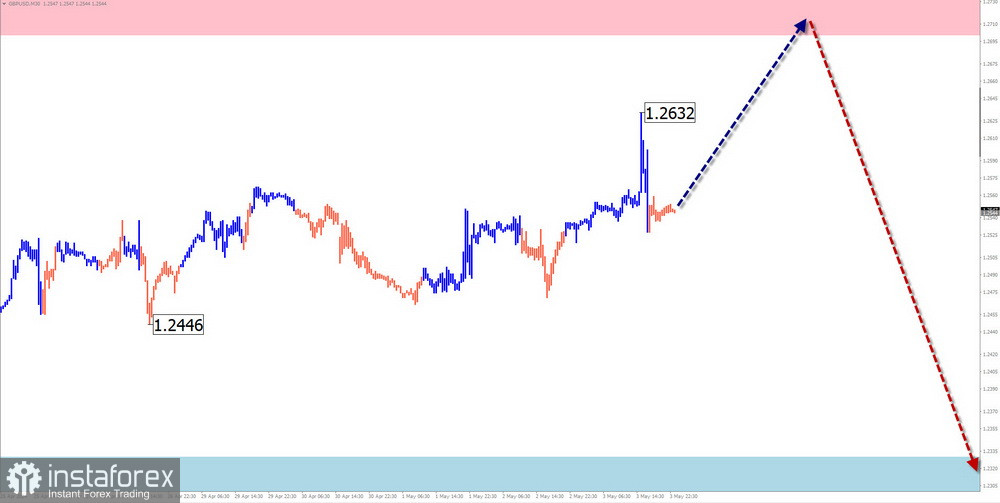
GBP/USD
Analysis:
The daily chart scale of the British pound shows that within the dominant descending plane of recent months, an intermediate retracement is forming in the final part (C). The unfinished segment in the upward direction dates back to April 22. The calculated resistance runs along the lower boundary of the wide potential reversal zone on the weekly timeframe.
Forecast:
The upcoming week is expected to see a general sideways movement in the price of the British pound. One should expect growth towards the calculated resistance zone in the coming days. Subsequently, there is a high probability of transitioning into a drift, followed by a further price decline. The greatest volatility is expected towards the end of the week.
Potential reversal zones
Resistance:
Support:
Recommendations:
Buying: Small volume purchases within the "intraday" framework can be profitable for the deposit.
Selling: Without confirmed reversal signals near the resistance zone, conditions for such transactions do not exist.
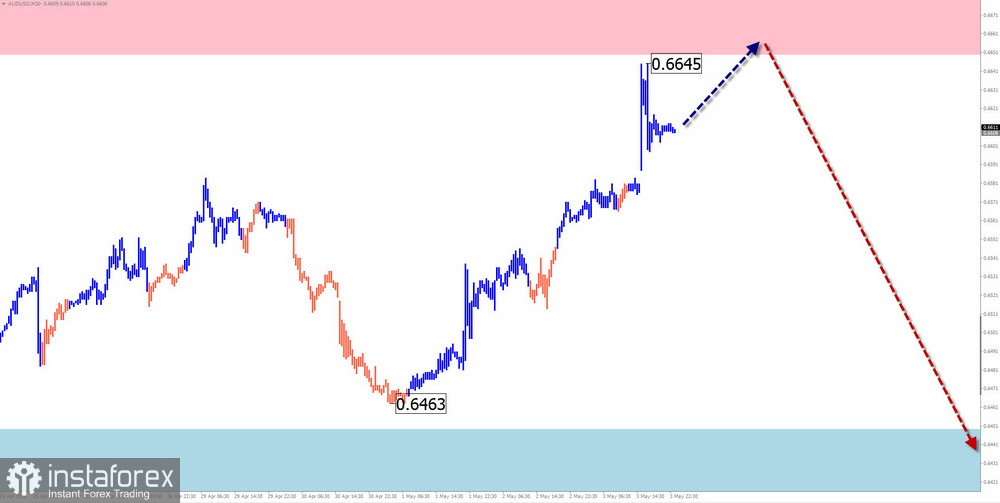
AUD/USD
Analysis:
In mid-October last year, an unfinished bearish wave structure started on the Australian dollar chart. Since the middle of last month, the price has taken a counter course, forming a complex correction. Quotes are squeezed within a narrow corridor between powerful counter zones in the higher timeframe.
Forecast:
A weakly ascending movement vector is more probable in the first few days of the upcoming week. A sideways movement is likely at the upper boundary of the price channel. Towards the end of the week, increased activity, reversal, and resumption of the downward course are expected.

Potential reversal zones
Resistance:
Support:
Recommendations:
Buying: High risk and may lead to losses.
Selling: After confirmed reversal signals appear near the resistance zone, there is potential for trading transactions.
USD/CHF
Analysis:
The ascending wave of the Swiss franc major, which started in December of last year, has entered its final phase. The price has approached the upper boundary of a powerful potential reversal zone. Since the beginning of May, the movement vector has changed to descending. The high wave level of this segment indicates the beginning of a full-fledged correction.
Forecast:
The current bearish price movement will likely transition into a sideways plane in the coming days. Breaking the boundaries of the calculated support next week is unlikely. Activation and resumption of price rises are more probable towards the end of the week.
Potential reversal zones
Resistance:
Support:
Recommendations:
Selling: Have low potential. Limiting trading time within trading sessions and reducing volume size is safer.
Buying: Transactions are futile until reversal signals appear near the support zone on your TF.
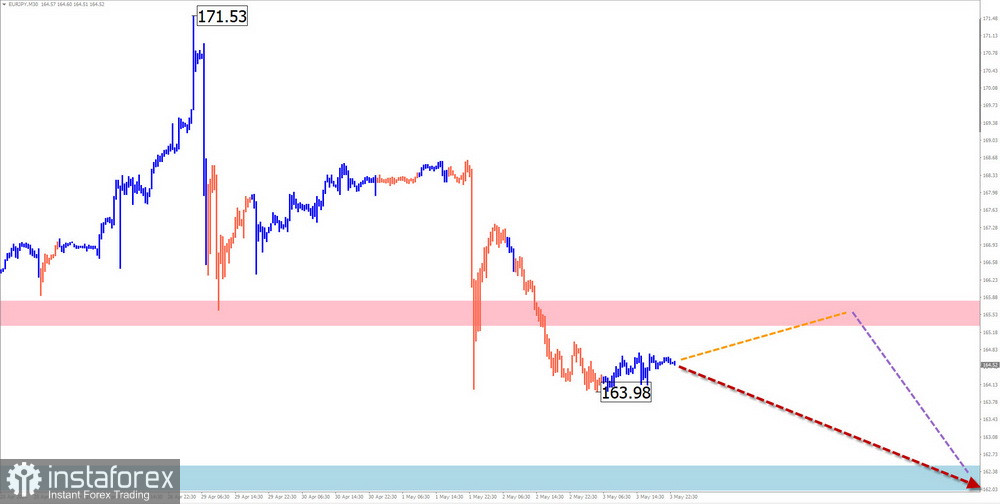
EUR/JPY
Analysis:
The euro/Japanese yen pair's relevant wave structure can be considered a bullish wave that started in early December of last year. Since the beginning of May, quotes have begun forming a correction from the powerful resistance zone on the weekly timeframe. The structure of this wave at the time of analysis is not complete.
Forecast:
In the upcoming week, price movement within the boundaries of the formed price corridor is expected. At the beginning of the week, sideways movement along the resistance zone is more probable. A change in course is expected by Wednesday-Thursday. Breaking the designated price channel further next week is unlikely.
Potential reversal zones
Resistance:
Support:
Recommendations:
Selling: This may be profitable after confirmed signals near the resistance zone.
Buying: Have low potential and may lead to losses.
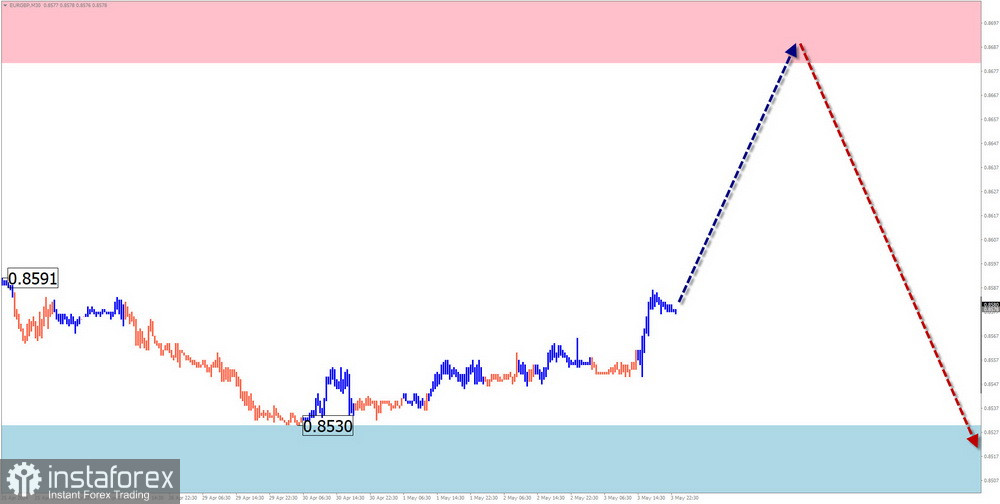
EUR/GBP
Analysis:
Since late December of last year, a descending wave has been forming on the euro/British pound chart. The price entered a sideways drift in March, forming a corrective part (B) on the chart. The structure of this wave segment does not indicate completion. The pair's rate has been near the lower boundary of the formed price corridor over the past months.
Forecast:
Sideways movement along the calculated resistance boundaries is expected in the coming days. There is a high probability that the rate will rise and pressure will be applied again in this zone. Subsequently, increased volatility, reversal, and resumption of price declines are expected.
Potential reversal zones
Resistance:
Support:
Recommendations:
Buying: Fractional volume purchases within the intraday framework are allowed.
Selling: This can be used in trading after reversal signals appear near the support zone on your TF.
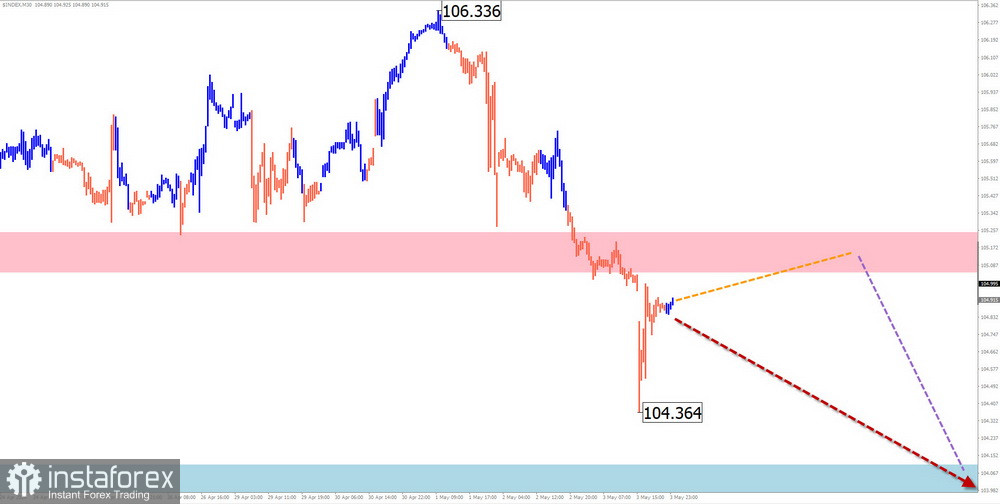
US dollar index
Analysis:
Since December of last year, the position of the US dollar relative to other currencies has steadily strengthened. Quotes have reached the lower boundary of the potential reversal zone on the monthly timeframe. Since mid-April, the index quotes have been forming a correction. The structure of this wave at the time of analysis is developing the final part (C).
Forecast:
The downward movement of dollar quotes will likely continue in the upcoming week. A pullback to the resistance zone will not be excluded in the coming days. Increased volatility and a resumption of decline are expected after that.
Potential reversal zones
Resistance:
Support:
Recommendations:
A weakening US dollar may give impetus to a short-term rise in the exchange rates of national currencies in major pairs. It is worth noting that this trend is temporary.
Explanation: In simplified wave analysis (SWA), all waves consist of 3 parts (A-B-C). The latest, unfinished wave is analyzed for each timeframe. Dashed lines indicate expected movements.
Attention: The wave algorithm does not consider the duration of instrument movements over time!
*The market analysis posted here is meant to increase your awareness, but not to give instructions to make a trade.
InstaSpot analytical reviews will make you fully aware of market trends! Being an InstaSpot client, you are provided with a large number of free services for efficient trading.


