


Our team has over 7,000,000 traders!
Every day we work together to improve trading. We get high results and move forward.
Recognition by millions of traders all over the world is the best appreciation of our work! You made your choice and we will do everything it takes to meet your expectations!
We are a great team together!
InstaSpot. Proud to work for you!


Actor, UFC 6 tournament champion and a true hero!
The man who made himself. The man that goes our way.
The secret behind Taktarov's success is constant movement towards the goal.
Reveal all the sides of your talent!
Discover, try, fail - but never stop!
InstaSpot. Your success story starts here!

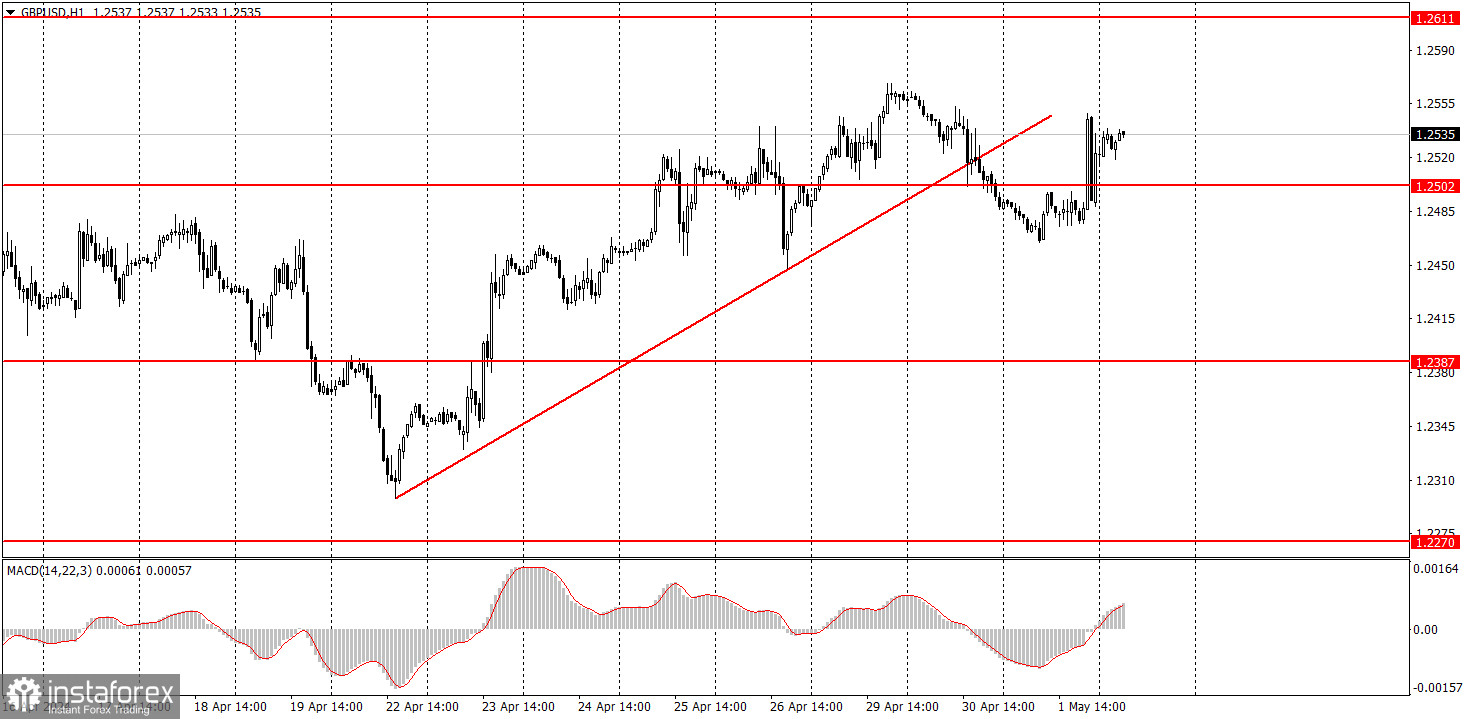
The GBP/USD pair hardly moved on Wednesday, as it was mostly stagnant throughout the day. Although the price settled below the ascending trendline in the preceding days, we did not see the desired downward movement on Wednesday. We already warned you that an upward movement was also possible due to strong fundamental and macroeconomic factors. However, unfortunately, the results of the FOMC meeting (which triggered the pair's rise) cannot be described as dovish. The British pound rose when it was initially expected to fall.
During the press conference, Federal Reserve Chair Jerome Powell said that the central bank is pushing back its plans for rate cuts, despite inflationary pressures. At the same time, since inflation has accelerated, Powell is unsure when the process of monetary policy easing will begin. As we can see, market participants could interpret Powell's words in either direction: there is no need to expect rate hikes, but neither should we expect an imminent cut. As usual, the market interpreted the news unfavorably for the dollar...
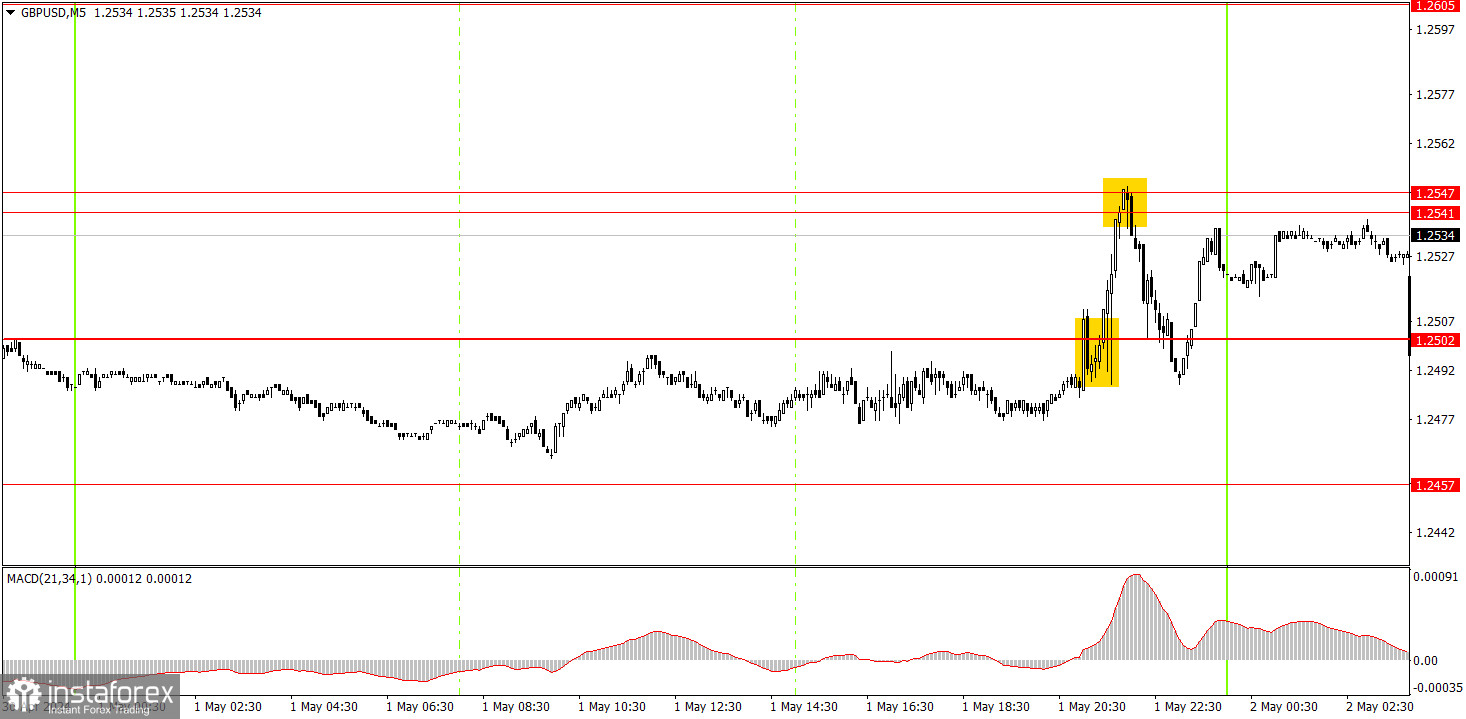
Several trading signals were generated on the 5-minute timeframe, but it all happened late in the evening, after the FOMC meeting. Reacting to Powell's statements and trying to predict market reactions to these statements is a grueling task. Therefore, we always advise you to wait for some time for the market to digest all the information before drawing conclusions and opening positions. Yesterday, we witnessed an upward movement. Traders could only act on a rebound from the area of 1.2541-1.2547, as this signal was strong and precise. However, even this signal was formed too late in the day.
On the hourly chart, the GBP/USD pair has excellent prospects for forming a downward trend, but is currently going through a correction. This corrective phase has been quite strong. The fundamental and macroeconomic backdrop continues to support the dollar much more than the British pound. Therefore, we only expect downward movement from the pair.
Today, novice traders can use the area of 1.2541-1.2547 as a reference point. A rebound from this area will make it possible for traders to sell the pair with targets at 1.2502 and 1.2457, which is logical and consistent. Traders may open long positions once the price overcomes this area, which is also a logical move.
The key levels on the 5M chart are 1.2270, 1.2310, 1.2372-1.2387, 1.2457, 1.2502, 1.2541-1.2547, 1.2605-1.2611, 1.2648, 1.2691, 1.2725, 1.2787-1.2791. On Thursday, there will be no significant events in the UK. The US docket will feature the number of initial jobless claims. The pair may show weak volatility, just like yesterday...
1) Signal strength is determined by the time taken for its formation (either a bounce or level breach). A shorter formation time indicates a stronger signal.
2) If two or more trades around a certain level are initiated based on false signals, subsequent signals from that level should be disregarded.
3) In a flat market, any currency pair can produce multiple false signals or none at all. In any case, the flat trend is not the best condition for trading.
4) Trading activities are confined between the onset of the European session and mid-way through the U.S. session, after which all open trades should be manually closed.
5) On the 30-minute timeframe, trades based on MACD signals are only advisable amidst substantial volatility and an established trend, confirmed either by a trendline or trend channel.
6) If two levels lie closely together (ranging from 5 to 15 pips apart), they should be considered as a support or resistance zone.
Support and Resistance price levels can serve as targets when buying or selling. You can place Take Profit levels near them.
Red lines represent channels or trend lines, depicting the current market trend and indicating the preferable trading direction.
The MACD(14,22,3) indicator, encompassing both the histogram and signal line, acts as an auxiliary tool and can also be used as a signal source.
Significant speeches and reports (always noted in the news calendar) can profoundly influence the price dynamics. Hence, trading during their release calls for heightened caution. It may be reasonable to exit the market to prevent abrupt price reversals against the prevailing trend.
Beginners should always remember that not every trade will yield profit. Establishing a clear strategy coupled with sound money management is the cornerstone of sustained trading success.
*The market analysis posted here is meant to increase your awareness, but not to give instructions to make a trade.
InstaSpot analytical reviews will make you fully aware of market trends! Being an InstaSpot client, you are provided with a large number of free services for efficient trading.


