


Our team has over 7,000,000 traders!
Every day we work together to improve trading. We get high results and move forward.
Recognition by millions of traders all over the world is the best appreciation of our work! You made your choice and we will do everything it takes to meet your expectations!
We are a great team together!
InstaSpot. Proud to work for you!


Actor, UFC 6 tournament champion and a true hero!
The man who made himself. The man that goes our way.
The secret behind Taktarov's success is constant movement towards the goal.
Reveal all the sides of your talent!
Discover, try, fail - but never stop!
InstaSpot. Your success story starts here!

The GBP/USD pair continued to correct higher with low volatility. The market had no strong reason to buy the pound on Wednesday. The US report for durable goods was slightly better than forecasts. However, the pair is still going through a corrective phase, so the pound may continue to appreciate for some time. The main thing is to avoid returning to square one, with the pair finding itself within the sideways channel of 1.25-1.28.
We believe that the macroeconomic and fundamental background is extremely weak for the British currency. We also believe that the pound is overbought and unreasonably expensive. However, as we can see, the market is not in a rush to sell. Therefore, the current bullish correction is quite logical, but the absence of a new decline raises doubts and questions again.
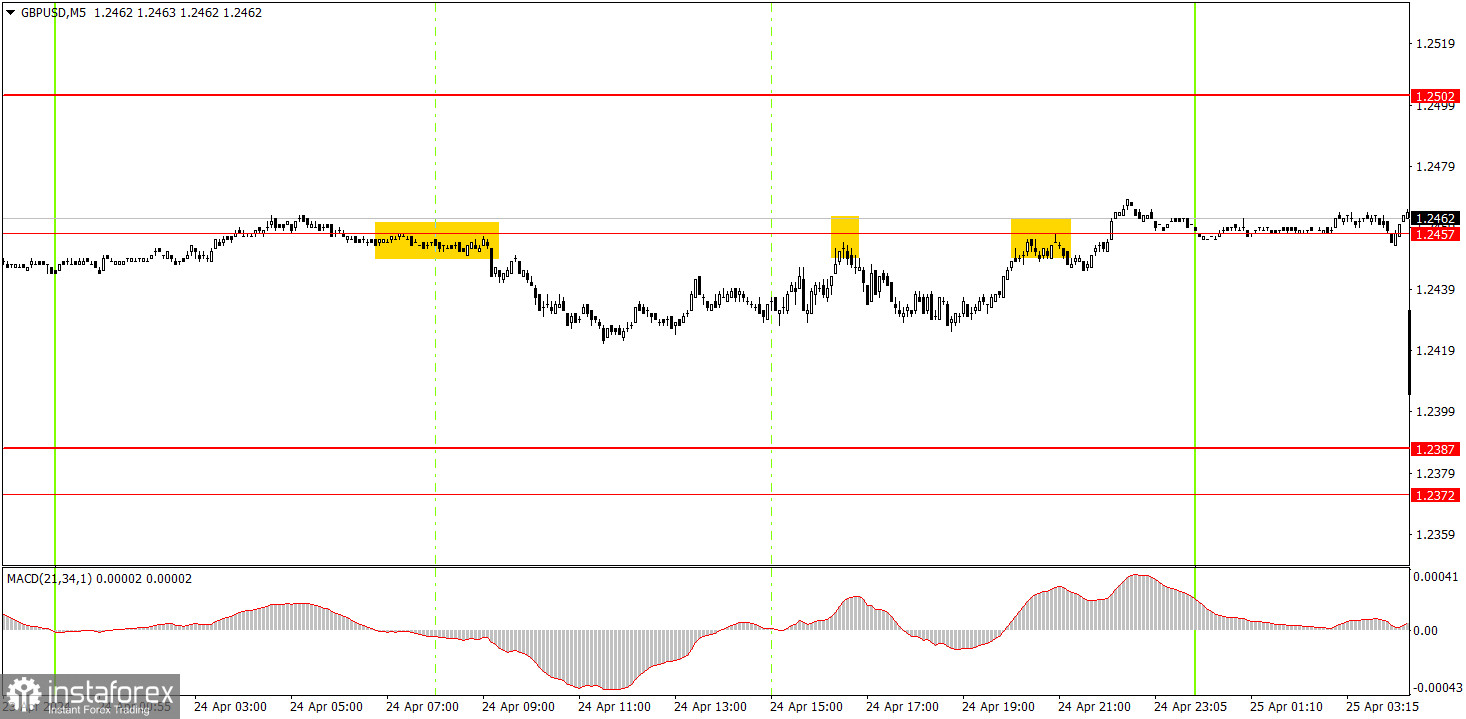
Three trading signals were formed on the 5-minute timeframe. The pair rebounded from the level of 1.2457 thrice. In the first two cases, the pair fell by about 20 pips after each rebound. Therefore, there could not have been any loss on the two short positions, as stop-loss orders should have been placed. However, it was not possible to make profit from these signals either. The signals were quite accurate and clear, but there was no volatility, so there were no movements on Wednesday.
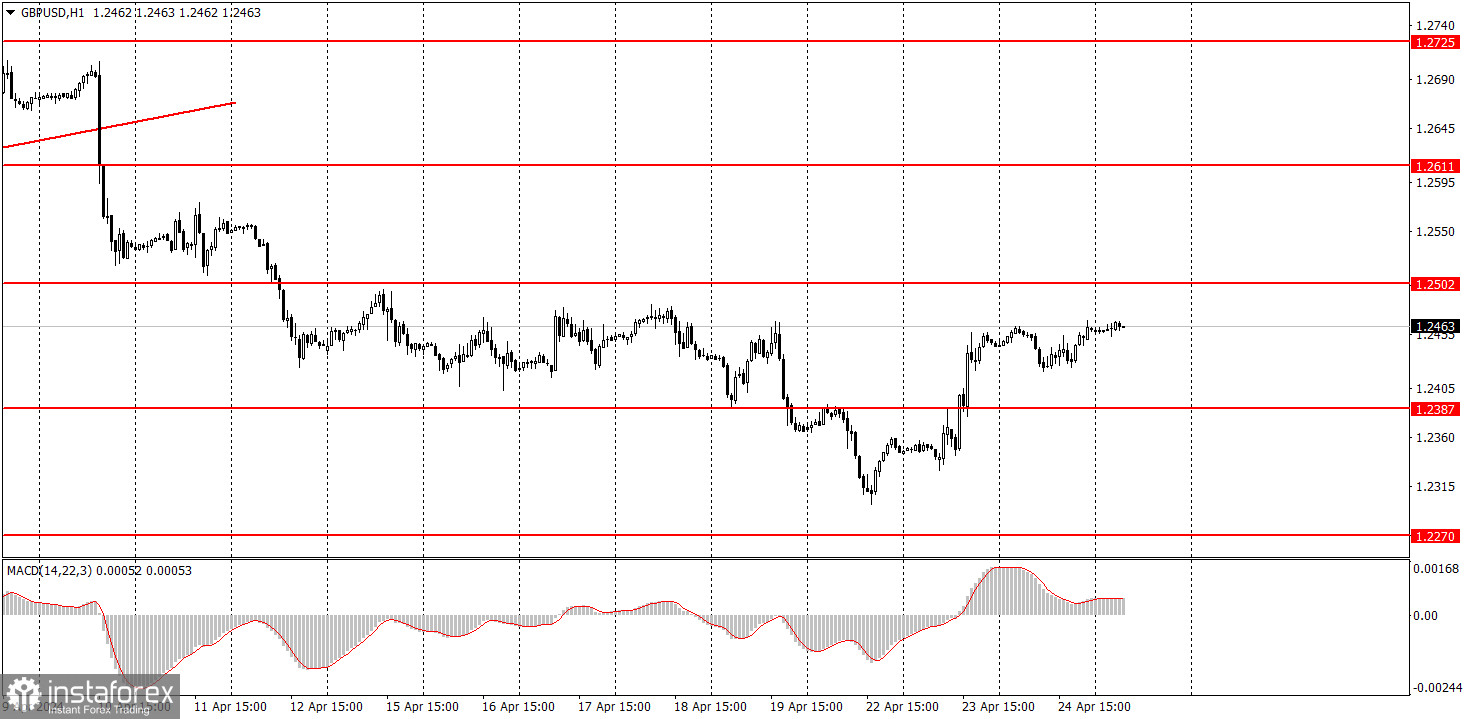
On the hourly chart, the GBP/USD pair has excellent prospects for forming a downward trend, but is currently going through a correction. After surpassing the level of 1.2502, traders may expect a significant decline from the pound. The fundamental and macroeconomic backdrop continues to support the dollar much more than the British pound. Therefore, we only expect downward movement from the pair.
Today, novice traders can look for new sell signals around the level of 1.2457. The market is not in a rush to sell, but the pound is gradually depreciating over time, which is a good sign. Today, the US GDP report could exert pressure on the dollar. But if the report shows good values, then the dollar should recover its previous losses.
The key levels on the 5M chart are 1.2270, 1.2310, 1.2372-1.2387, 1.2457, 1.2502, 1.2544, 1.2605-1.2611, 1.2648, 1.2691, 1.2725, 1.2787-1.2791. There are no significant events scheduled in the UK, while the US will release an important GDP report, and a secondary report on orders for durable goods. Take note that even the GDP report may not affect volatility if its value coincides with forecasts.
1) Signal strength is determined by the time taken for its formation (either a bounce or level breach). A shorter formation time indicates a stronger signal.
2) If two or more trades around a certain level are initiated based on false signals, subsequent signals from that level should be disregarded.
3) In a flat market, any currency pair can produce multiple false signals or none at all. In any case, the flat trend is not the best condition for trading.
4) Trading activities are confined between the onset of the European session and mid-way through the U.S. session, after which all open trades should be manually closed.
5) On the 30-minute timeframe, trades based on MACD signals are only advisable amidst substantial volatility and an established trend, confirmed either by a trendline or trend channel.
6) If two levels lie closely together (ranging from 5 to 15 pips apart), they should be considered as a support or resistance zone.
Support and Resistance price levels can serve as targets when buying or selling. You can place Take Profit levels near them.
Red lines represent channels or trend lines, depicting the current market trend and indicating the preferable trading direction.
The MACD(14,22,3) indicator, encompassing both the histogram and signal line, acts as an auxiliary tool and can also be used as a signal source.
Significant speeches and reports (always noted in the news calendar) can profoundly influence the price dynamics. Hence, trading during their release calls for heightened caution. It may be reasonable to exit the market to prevent abrupt price reversals against the prevailing trend.
Beginners should always remember that not every trade will yield profit. Establishing a clear strategy coupled with sound money management is the cornerstone of sustained trading success.
*The market analysis posted here is meant to increase your awareness, but not to give instructions to make a trade.
InstaSpot analytical reviews will make you fully aware of market trends! Being an InstaSpot client, you are provided with a large number of free services for efficient trading.


