


Our team has over 7,000,000 traders!
Every day we work together to improve trading. We get high results and move forward.
Recognition by millions of traders all over the world is the best appreciation of our work! You made your choice and we will do everything it takes to meet your expectations!
We are a great team together!
InstaSpot. Proud to work for you!


Actor, UFC 6 tournament champion and a true hero!
The man who made himself. The man that goes our way.
The secret behind Taktarov's success is constant movement towards the goal.
Reveal all the sides of your talent!
Discover, try, fail - but never stop!
InstaSpot. Your success story starts here!

EUR/USD
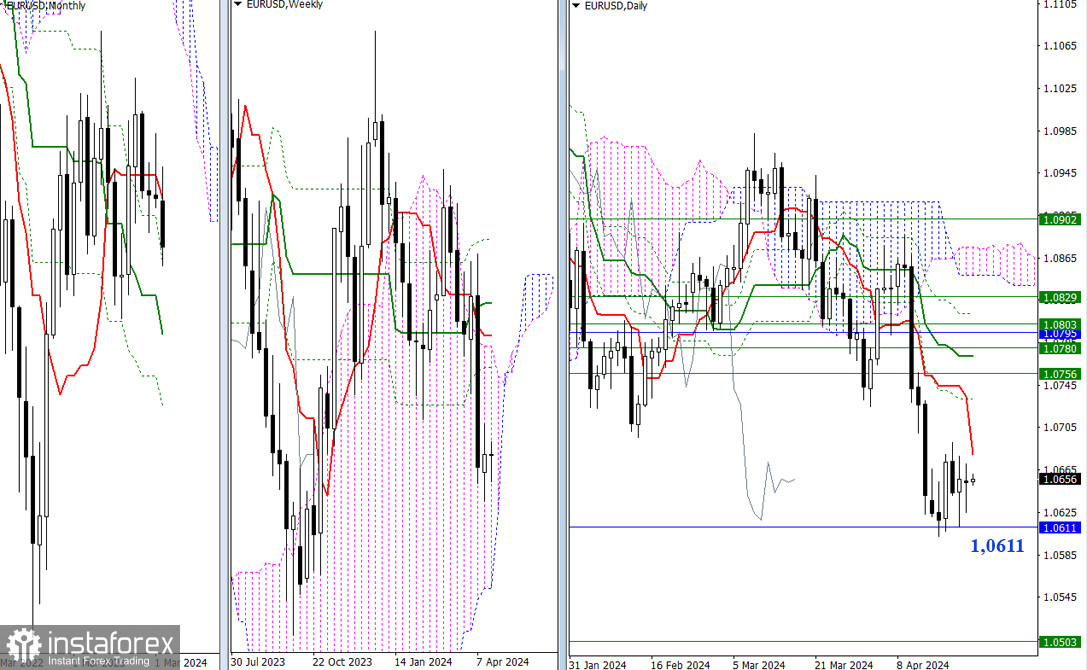
Higher Timeframes
No significant changes over the past 24 hours. Consolidation continues, so uncertainty persists. The daily short-term trend has moved closer to the price chart. Today, it can be found at 1.0680, practically within the consolidation area. In case of upward movement, the next resistances are located around 1.0732-56 (daily + weekly Fibonacci Kijuns). If the bears manage to leave the consolidation area by breaking the current support level (1.0611), then traders will focus on the support of the lower boundary of the weekly cloud.
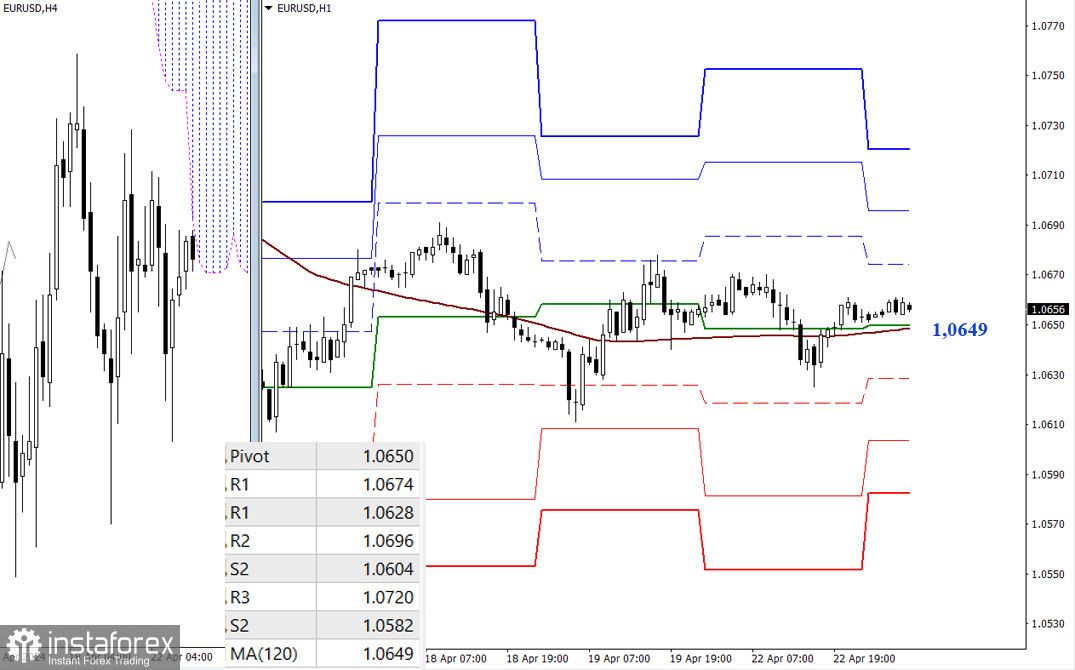
H4 – H1
The uncertainty found in higher time frames causes the pair to revolve around the weekly long-term trend (1.0649). Trading above this mark increases the chances of an upward movement, with the classic Pivot levels serving as reference points for the intraday rise (1.0674 - 1.0696 - 1.0720). A breakout (1.0649) and trading below this mark could create a favorable environment for the bears. In case the pair falls, the bears will focus on breaking through the support levels of the classic Pivot points (1.0628 - 1.0604 - 1.0582).
***
GBP/USD
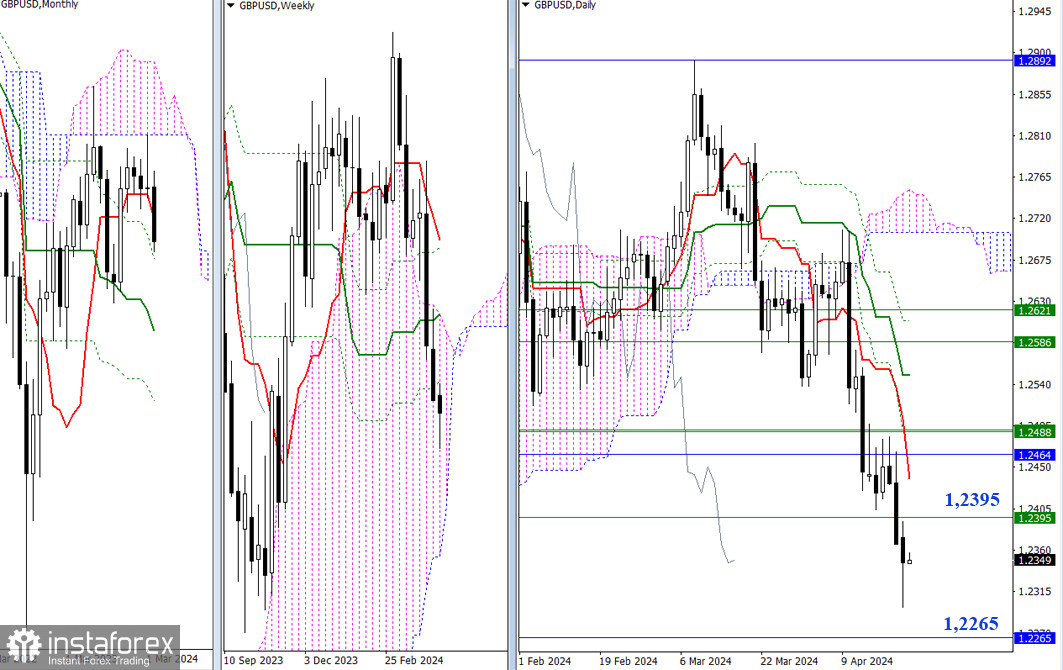
Higher Timeframes
Yesterday, the previous day's low was updated and the pair continued to decline. The nearest reference point is the monthly support level (1.2265). If market sentiment changes and the bulls try to recover their positions, they will encounter resistance levels such as 1.2395 (weekly Fibonacci Kijun), 1.2437 (daily short-term trend), and 1.2464 (monthly short-term trend).
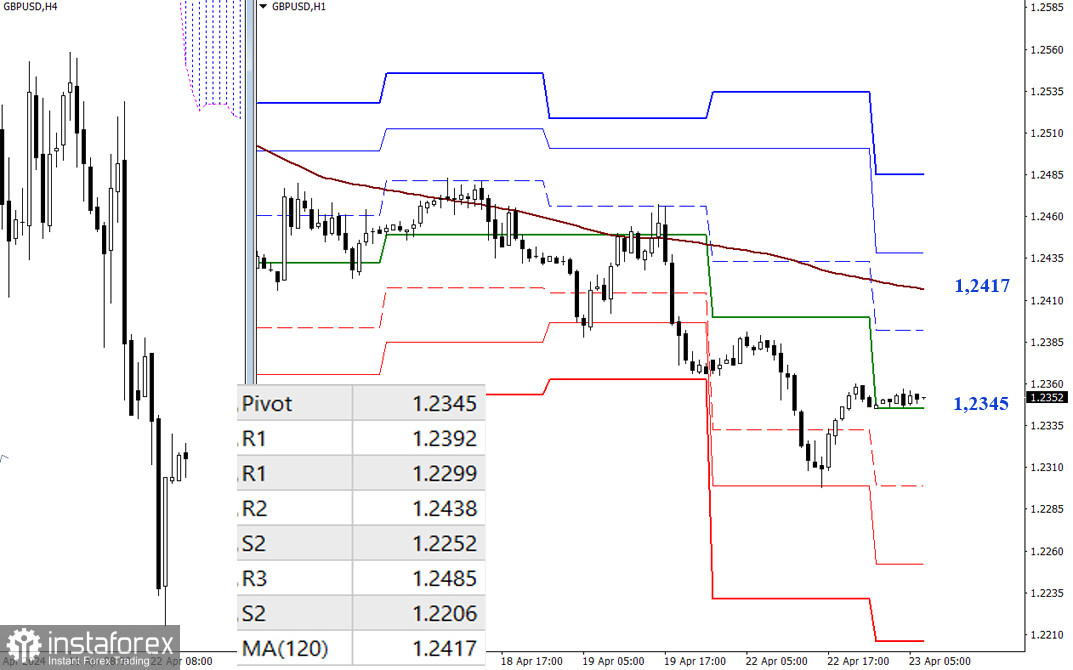
H4 – H1
The bears have the advantage on the lower time frames, but the pair is in the correction area and has settled above the central Pivot level of the day (1.2345). If the bears become active and the corrective phase ends, traders may focus on the support levels of the classic Pivot points, which are located at 1.2299 - 1.2252 - 1.2206. If the pair corrects higher, the bulls may push the price to the key level that is responsible for the current balance of forces, the weekly long-term trend (1.2417), and today, the intermediate resistance on this path may be R1 (1.2392).
***
The technical analysis of the situation uses:
Higher timeframes - Ichimoku Kinko Hyo (9.26.52) + Fibonacci Kijun levels
Lower timeframes - H1 - Pivot Points (classic) + Moving Average 120 (weekly long-term trend)
*The market analysis posted here is meant to increase your awareness, but not to give instructions to make a trade.
InstaSpot analytical reviews will make you fully aware of market trends! Being an InstaSpot client, you are provided with a large number of free services for efficient trading.


