


Our team has over 7,000,000 traders!
Every day we work together to improve trading. We get high results and move forward.
Recognition by millions of traders all over the world is the best appreciation of our work! You made your choice and we will do everything it takes to meet your expectations!
We are a great team together!
InstaSpot. Proud to work for you!


Actor, UFC 6 tournament champion and a true hero!
The man who made himself. The man that goes our way.
The secret behind Taktarov's success is constant movement towards the goal.
Reveal all the sides of your talent!
Discover, try, fail - but never stop!
InstaSpot. Your success story starts here!

EUR/USD resumed its strong downward movement, and there weren't any current, local macroeconomic reasons behind it. However, this doesn't mean that there was generally no reason behind it. Over the past months, we have often mentioned that the euro should be cheaper compared to the US dollar. And there were and still are plenty of reasons for this. The weak state of the EU economy compared to the US. The market's dreams that the Federal Reserve would be the first to lower rates, based on which it sold the dollar for a long time. The technical picture, according to which, a downward trend started on the daily timeframe last year. The single currency was supposed to fall for these reasons. And as expected, the euro fell on Friday.
Of course, no one expects the euro to decline every day now. We have observed ultra-low volatility for many weeks, so it is unlikely that the euro will depreciate by 100 pips every day. However, the fact is that it should continue to move towards 1.0200-1.0450. That's what we expect.
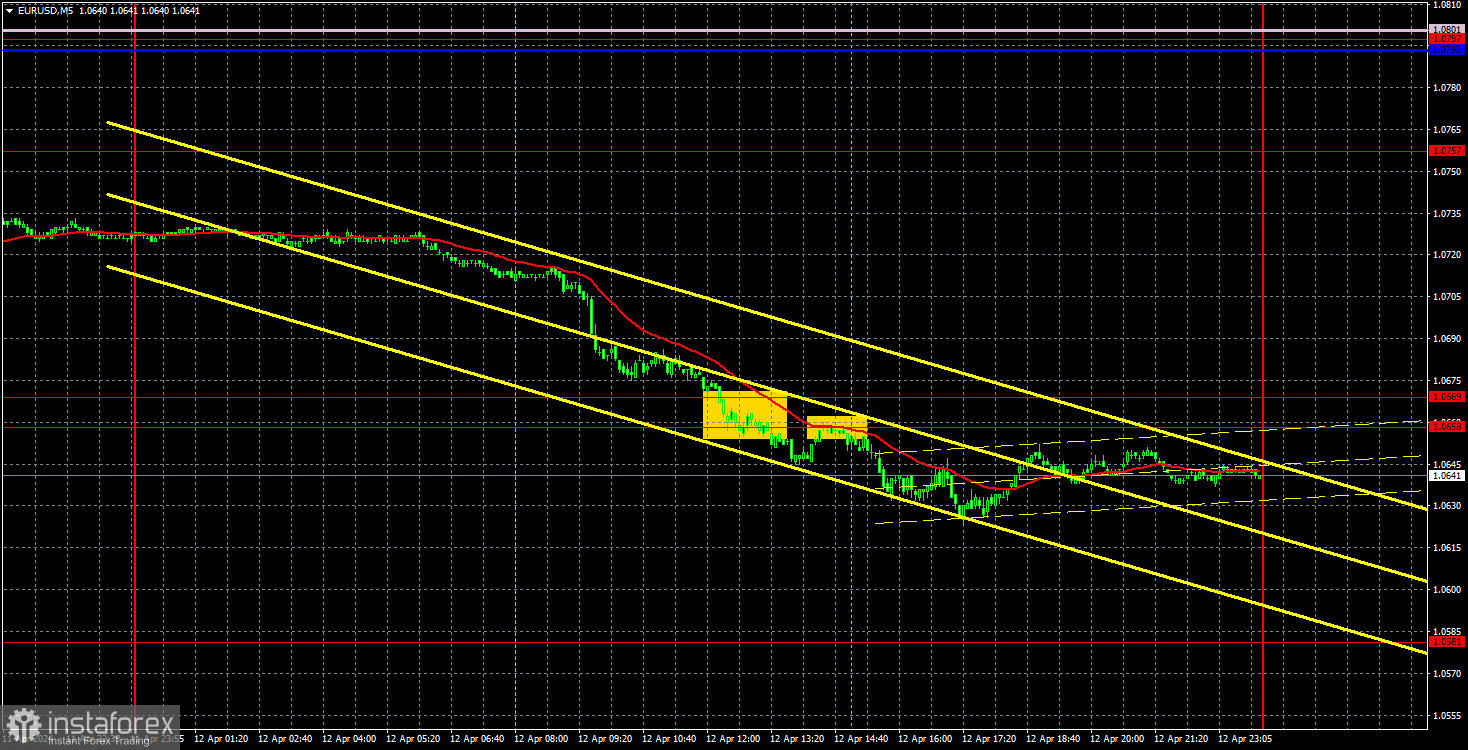
There were two trading signals on Friday, unfortunately, they were formed when most of the downward movement was already behind us. Nevertheless, traders could still open short positions after overcoming the area of 1.0658-1.0669. Profit from this trade could have been 10-20 pips. Better than nothing.
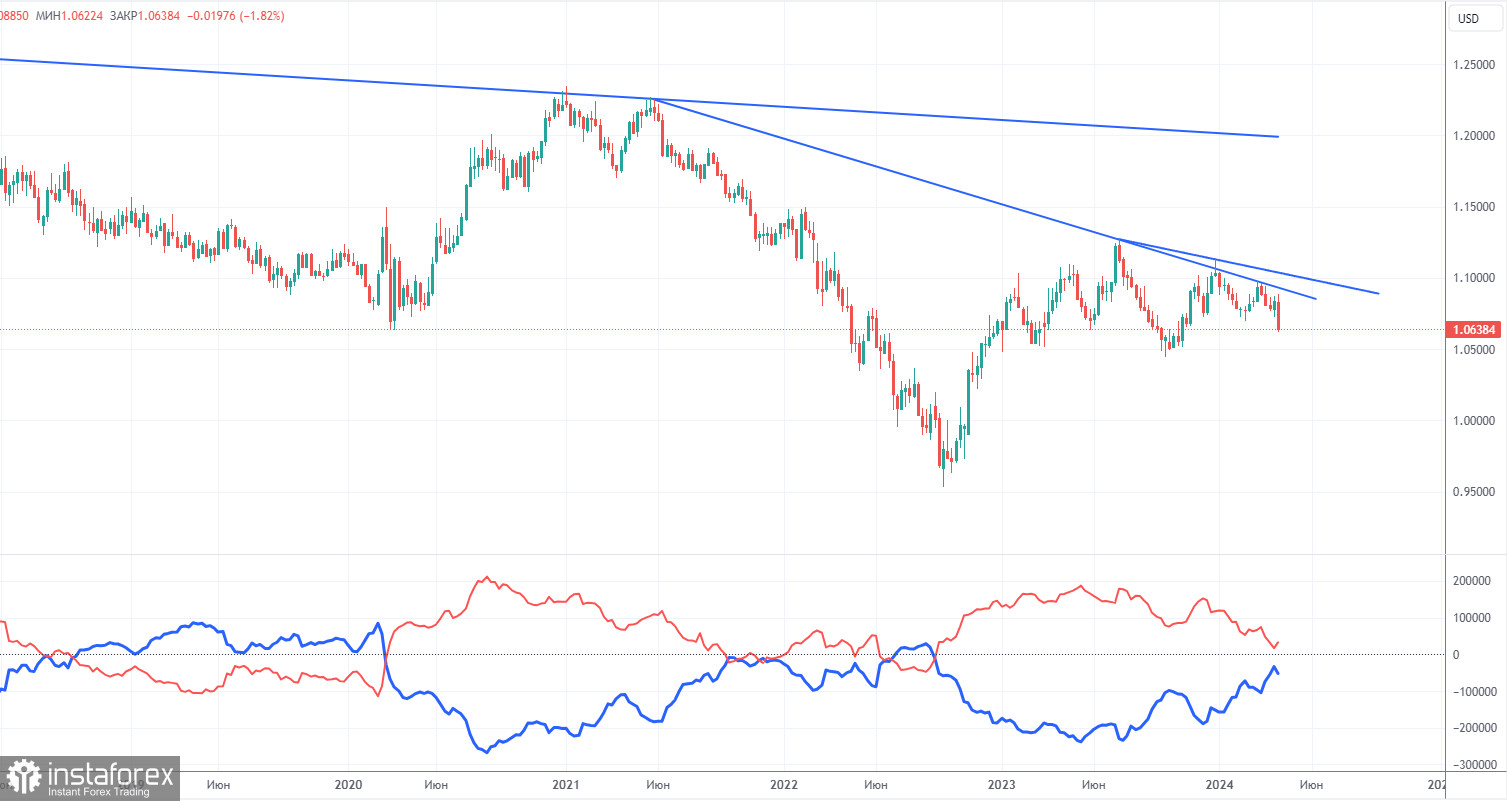
The latest COT report is dated April 9th. The net position of non-commercial traders has been bullish for quite some time. Basically, the number of long positions in the market is higher than the number of short positions. However, at the same time, the net position of non-commercial traders (red line) has been decreasing in recent months, while that of commercial traders (blue line) has been increasing. This shows that market sentiment is turning bearish, as speculators continue to sell the euro. Furthermore, we don't see any fundamental factors that can support the euro's strength, while technical analysis also suggests a downtrend. Three descending trend lines on the weekly chart indicate that there's a good chance of continuing the decline.
At present, the red and blue lines are moving towards each other (indicating a trend reversal after a rise). Therefore, we believe that the euro will fall further. During the last reporting week, the number of long positions for the non-commercial group decreased by 12,800, while the number of short positions decreased by 28,700. Accordingly, the net position increased by 15,900. Overall, both the euro and the net position continue to decline. The number of buy contracts is higher than the number of sell contracts among non-commercial traders by only 32,700 (previously 31,000).
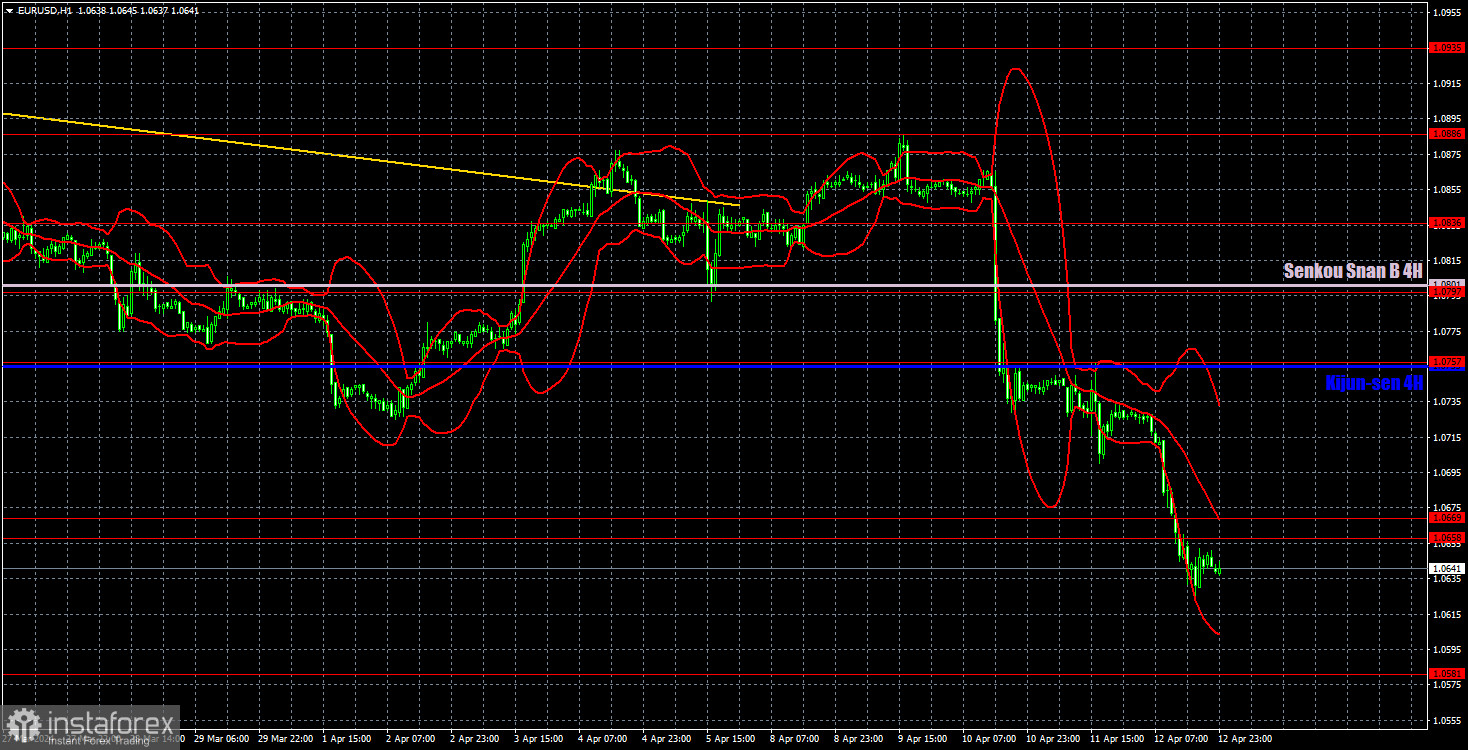
On the 1-hour chart, EUR/USD resumed its downward trend. Since expectations for Fed rate cuts in 2024 have significantly been reduced, the US dollar can and should continue to rise for a couple more months at least. Especially as the ECB is expected to ease its monetary policy very soon. Practically all the factors currently point to the US dollar's growth.
On April 15, we highlight the following levels for trading: 1.0530, 1.0581, 1.0658-1.0669, 1.0757, 1.0797, 1.0836, 1.0886, 1.0935, 1.1006, 1.1092, as well as the Senkou Span B line (1.0801) and the Kijun-sen (1.0755) lines. The Ichimoku indicator lines can move during the day, so this should be taken into account when identifying trading signals. Don't forget to set a Stop Loss to breakeven if the price has moved in the intended direction by 15 pips. This will protect you against potential losses if the signal turns out to be false.
The euro area industrial production report and the US retail sales data will be published on Monday. Theoretically, the US report could provoke a significant market reaction, but for this to happen, the actual value must significantly differ from the forecast. The pair could start a corrective movement since it has lost over 200 pips in two days. However, currently, the market sentiment is firmly bearish, so it's possible that the downward movement will persist on Monday, albeit with less intensity.
Support and resistance levels are thick red lines near which the trend may end. They do not provide trading signals;
The Kijun-sen and Senkou Span B lines are the lines of the Ichimoku indicator, plotted to the 1H timeframe from the 4H one. They provide trading signals;
Extreme levels are thin red lines from which the price bounced earlier. They provide trading signals;
Yellow lines are trend lines, trend channels, and any other technical patterns;
Indicator 1 on the COT charts is the net position size for each category of traders;
*The market analysis posted here is meant to increase your awareness, but not to give instructions to make a trade.
InstaSpot analytical reviews will make you fully aware of market trends! Being an InstaSpot client, you are provided with a large number of free services for efficient trading.


