


Our team has over 7,000,000 traders!
Every day we work together to improve trading. We get high results and move forward.
Recognition by millions of traders all over the world is the best appreciation of our work! You made your choice and we will do everything it takes to meet your expectations!
We are a great team together!
InstaSpot. Proud to work for you!


Actor, UFC 6 tournament champion and a true hero!
The man who made himself. The man that goes our way.
The secret behind Taktarov's success is constant movement towards the goal.
Reveal all the sides of your talent!
Discover, try, fail - but never stop!
InstaSpot. Your success story starts here!

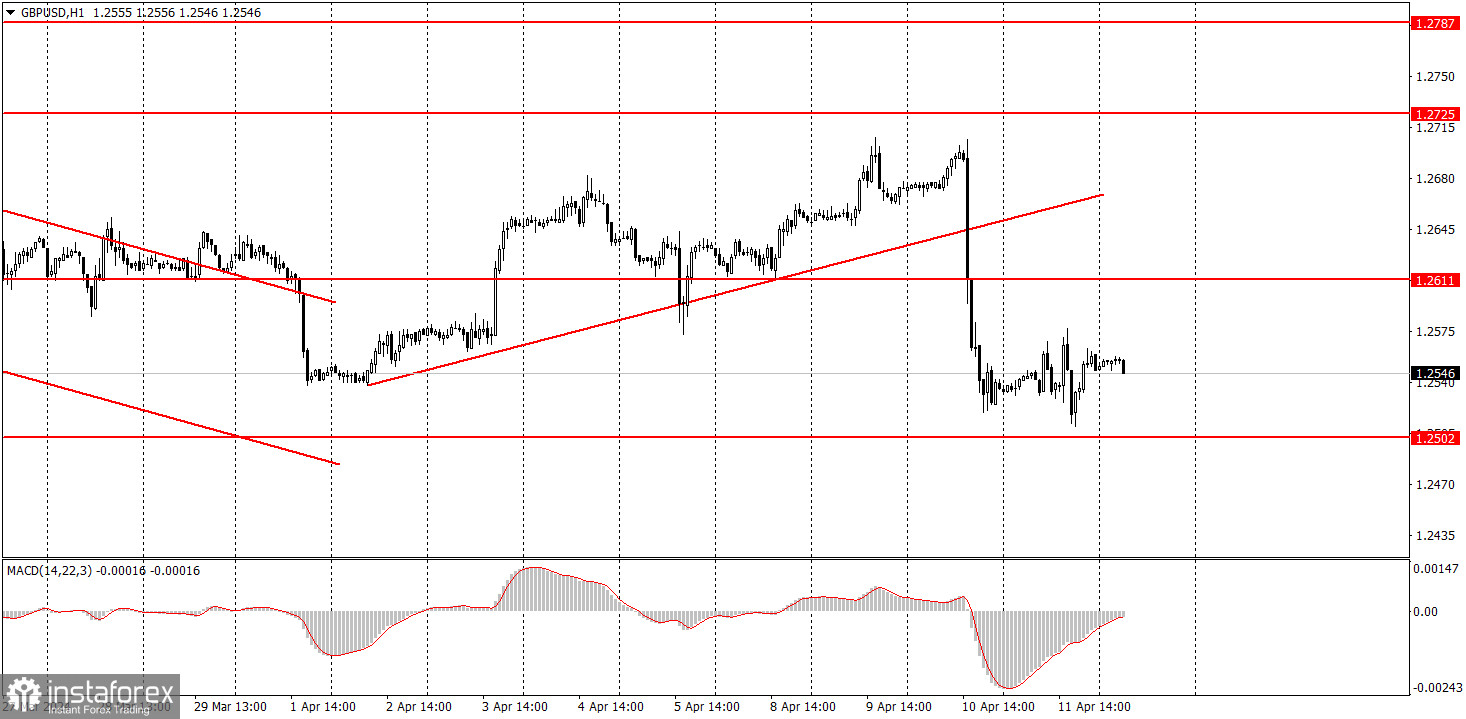
The GBP/USD pair did not show any interesting movements on Thursday, following its typical behavior over the past four months. Throughout the day, the pair moved sideways with low volatility, remaining in close proximity to the level of 1.2502, which can be considered as the lower boundary of the sideways channel on the 24-hour timeframe. Therefore, we are forced to acknowledge that the pair failed to settle below the sideways channel, and therefore, the flat trend persists. Despite the fact that the US dollar has all the reasons to show a firm upward movement. However, even if the pair fell by 200 pips on Wednesday, the market once again showed that it is not willing to sell the British pound below the 1.25 level. Perhaps the Bank of England is preventing the pound from falling further by conducting secret currency interventions. Whatever the case may be, the fact is that the flat trend persists.
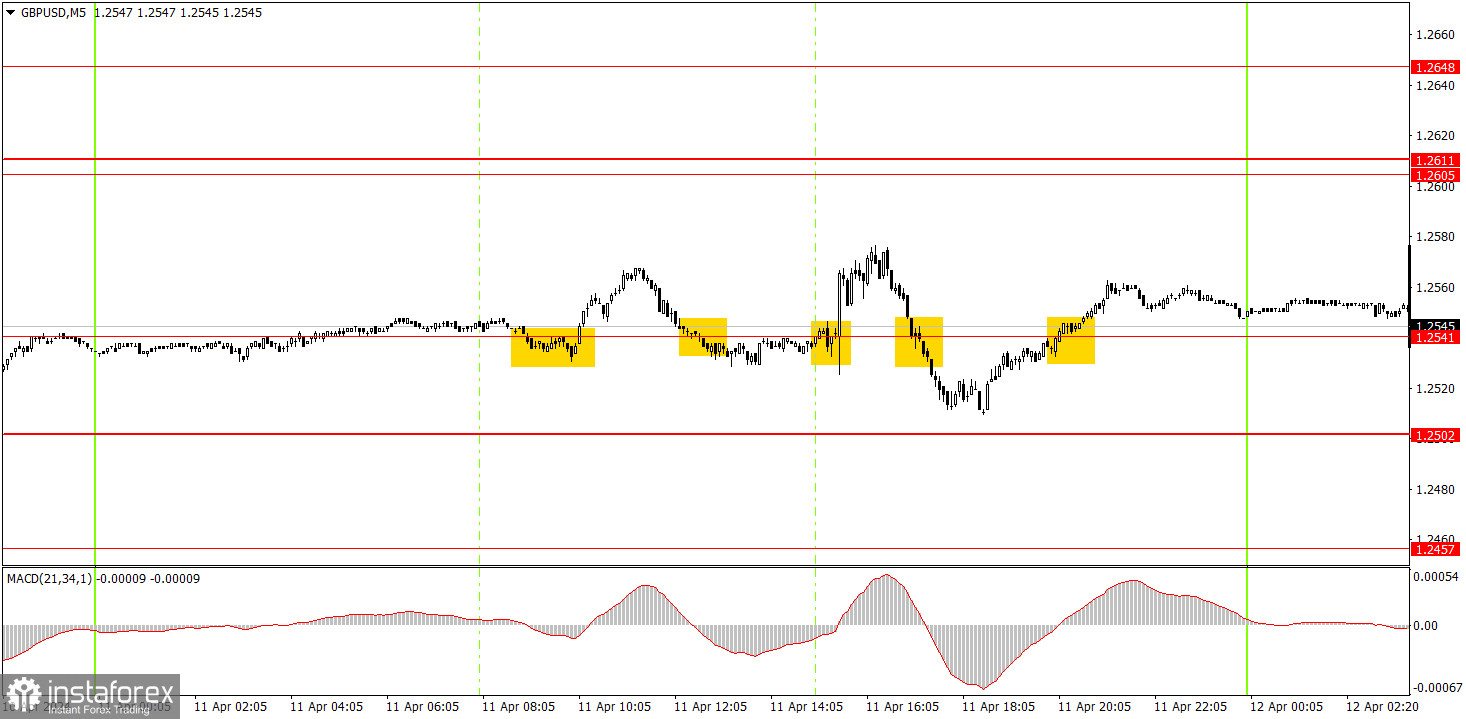
Five trading signals were formed near the same level of 1.2541 on the 5-minute timeframe. Since there was no trend, we believe that these were false signals. The pair did not reach the target levels, although they seemed to be quite close to the points where signals are formed. Therefore, beginners could have acted on the first two signals. Both trades closed at a small loss, which reminds us that if the market is flat and volatility is low, it is quite problematic to make a profit on any trading signals.
On the hourly chart, the GBP/USD pair plummeted, but the flat trend persists on the 24-hour timeframe. Unfortunately, the market doesn't always trade in a logical manner, so we cannot rule out the possibility of a new upward movement within the sideways channel starting today. Therefore, in the coming weeks, we can expect the pair to rise towards the 1.2800 level, but if we can confirm that the price has firmly breached the 1.2502 level, this will indicate a possible end to the flat trend.
On Friday, novice traders can look for buy signals above the level of 1.2502 and sell signals below this level. It is difficult for us to say whether the market is ready to break the pair out of the 4-month sideways channel. For now, it doesn't seem like it.
The key levels on the 5M chart are 1.2372-1.2387, 1.2457, 1.2502, 1.2544, 1.2605-1.2611, 1.2648, 1.2691, 1.2725, 1.2787-1.2791, 1.2848-1.2860, 1.2913, 1.2981-1.2993. Today, the UK will release reports on GDP and industrial production for February, which are not crucial, and the University of Michigan Consumer Sentiment Index will be released in the US, which is not important either.
1) Signal strength is determined by the time taken for its formation (either a bounce or level breach). A shorter formation time indicates a stronger signal.
2) If two or more trades around a certain level are initiated based on false signals, subsequent signals from that level should be disregarded.
3) In a flat market, any currency pair can produce multiple false signals or none at all. In any case, the flat trend is not the best condition for trading.
4) Trading activities are confined between the onset of the European session and mid-way through the U.S. session, after which all open trades should be manually closed.
5) On the 30-minute timeframe, trades based on MACD signals are only advisable amidst substantial volatility and an established trend, confirmed either by a trendline or trend channel.
6) If two levels lie closely together (ranging from 5 to 15 pips apart), they should be considered as a support or resistance zone.
Support and Resistance price levels can serve as targets when buying or selling. You can place Take Profit levels near them.
Red lines represent channels or trend lines, depicting the current market trend and indicating the preferable trading direction.
The MACD(14,22,3) indicator, encompassing both the histogram and signal line, acts as an auxiliary tool and can also be used as a signal source.
Significant speeches and reports (always noted in the news calendar) can profoundly influence the price dynamics. Hence, trading during their release calls for heightened caution. It may be reasonable to exit the market to prevent abrupt price reversals against the prevailing trend.
Beginners should always remember that not every trade will yield profit. Establishing a clear strategy coupled with sound money management is the cornerstone of sustained trading success.
*The market analysis posted here is meant to increase your awareness, but not to give instructions to make a trade.
InstaSpot analytical reviews will make you fully aware of market trends! Being an InstaSpot client, you are provided with a large number of free services for efficient trading.


