


Our team has over 7,000,000 traders!
Every day we work together to improve trading. We get high results and move forward.
Recognition by millions of traders all over the world is the best appreciation of our work! You made your choice and we will do everything it takes to meet your expectations!
We are a great team together!
InstaSpot. Proud to work for you!


Actor, UFC 6 tournament champion and a true hero!
The man who made himself. The man that goes our way.
The secret behind Taktarov's success is constant movement towards the goal.
Reveal all the sides of your talent!
Discover, try, fail - but never stop!
InstaSpot. Your success story starts here!

Trend analysis:
GBP/USD may start moving upward in April, rising from the closing of the March monthly candle at 1.2622 to the historical resistance level of 1.2848 (blue dashed line). After that, it will climb toward the upper fractal located at 1.3139 (yellow dashed line).
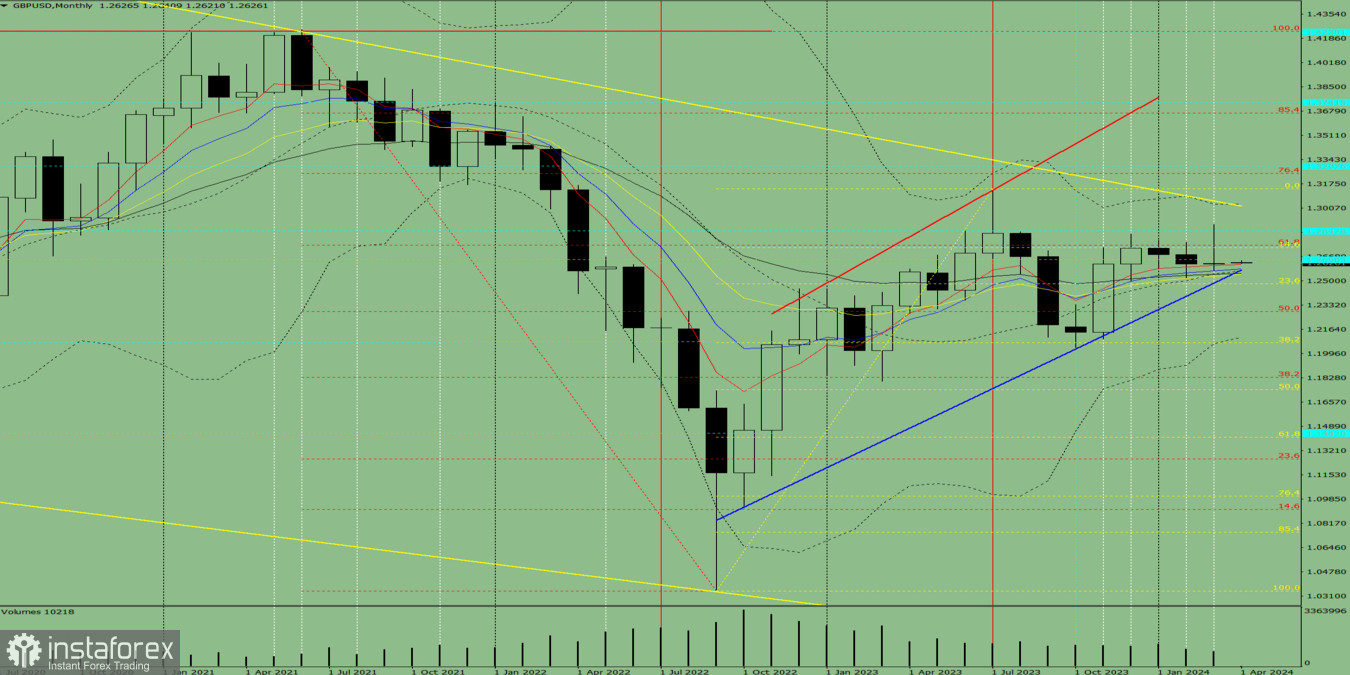
Fig. 1 (monthly chart)
Comprehensive analysis:
Indicator analysis - uptrend
Fibonacci levels - uptrend
Volumes - uptrend
Candlestick analysis - uptrend
Trend analysis - uptrend
Bollinger bands - uptrend
Conclusion: All signals point to an upward movement in GBP/USD.
Overall conclusion: The pair will have a bullish trend, with no first lower shadow on the monthly white candle (first week of month - white) and a second upper shadow (last week of the month - black).
Therefore, for this month, pound will rise from 1.2622 (closing of the March monthly candle) to the historical resistance level of 1.2848 (blue dashed line), and then approach the upper fractal located at 1.3139 (yellow dashed line).
Alternatively, it could go up from 1.2622 (closing of the March monthly candle) to the upper fractal located at 1.2892 (monthly candle from March 2024), followed by a decline to the 14.6% retracement level of 1.2730 (yellow dashed line).
*The market analysis posted here is meant to increase your awareness, but not to give instructions to make a trade.
InstaSpot analytical reviews will make you fully aware of market trends! Being an InstaSpot client, you are provided with a large number of free services for efficient trading.


