


Our team has over 7,000,000 traders!
Every day we work together to improve trading. We get high results and move forward.
Recognition by millions of traders all over the world is the best appreciation of our work! You made your choice and we will do everything it takes to meet your expectations!
We are a great team together!
InstaSpot. Proud to work for you!


Actor, UFC 6 tournament champion and a true hero!
The man who made himself. The man that goes our way.
The secret behind Taktarov's success is constant movement towards the goal.
Reveal all the sides of your talent!
Discover, try, fail - but never stop!
InstaSpot. Your success story starts here!

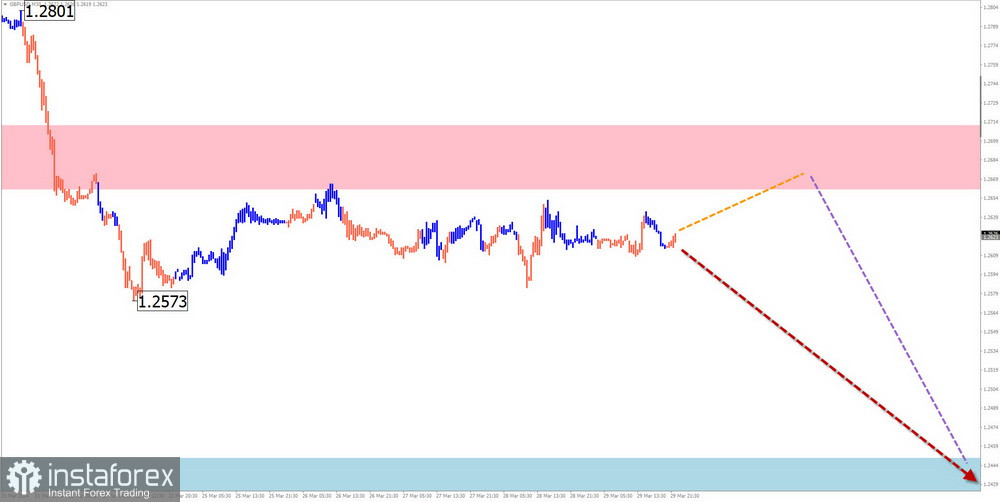
GBP/USD
Analysis:
The analysis of the daily chart of the British currency against the dollar shows the unfinished downward wave since July 13th of the previous year. The first two parts (A-B) are fully completed in its structure. Since March 8th, the final part of the wave (C) has started downward. The wave is developing as an impulse. An intermediate retracement was forming in a sideways plane throughout the past week.
Forecast:
In the coming days, the completion of the flat mood in the movement of the British pound is expected. In the latter half of the week, a reversal formation and a resumption of the price decline can be expected around the resistance zone. The calculated support demonstrates the lower boundary of the expected weekly range.
Potential Reversal Zones
Resistance:
Support:
Recommendations:
Buying: conditions for such transactions are not present.
Selling: will become relevant after confirmed reversal signals appear around the resistance zone.
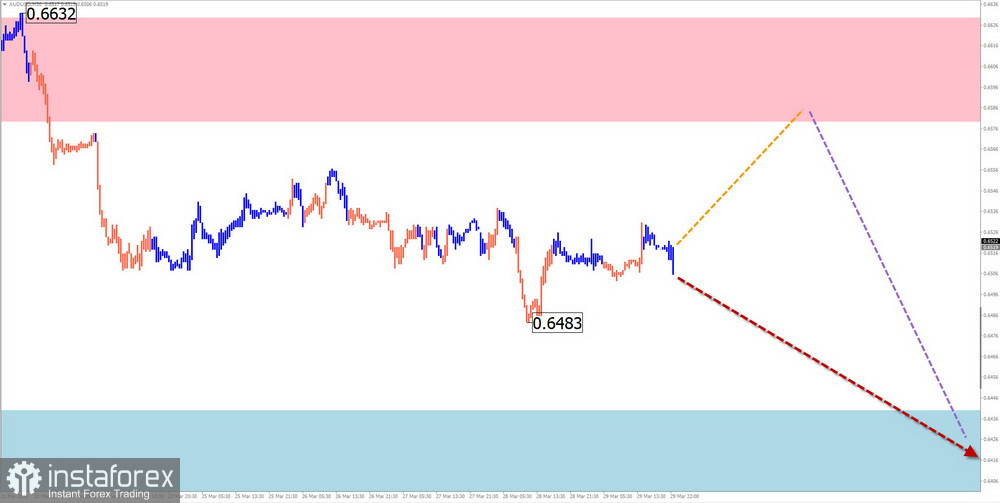
AUD/USD
Analysis:
Since the end of December of the previous year, a downward wave has continued to develop in the chart of the major Australian dollar pair. On March 21st, a corrective phase was completed, taking the form of an elongated plane. The subsequent downward segment possesses reversal potential. Within it, the price retreated downward in the last week.
Forecast:
During the upcoming week, a movement of the Australian dollar quotes in a sideways corridor between the nearest counter-direction zones can be expected. An upward vector is more probable in the first half. A change in direction and a resumption of the price decline can be expected closer to the weekend.
Potential Reversal Zones
Resistance:
Support:
Recommendations:
Buying: possible with fractional volumes within individual sessions. The potential is limited by resistance.
Selling: may be considered for trading transactions after corresponding reversal signals from your trading systems appear in the resistance zone.
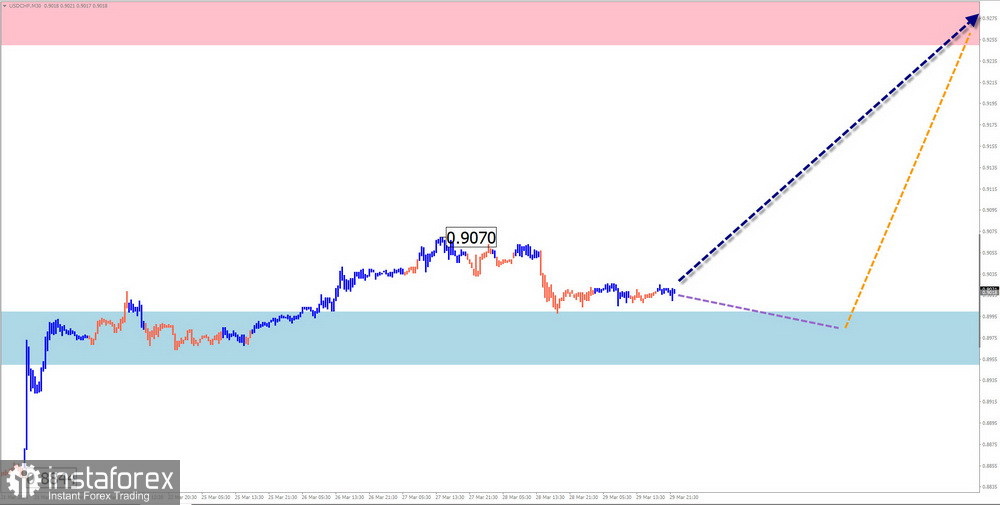
USD/CHF
Analysis:
In the short term, the direction of the price movement of the major Swiss franc pair is set by the upward wave algorithm since the end of December of the previous year. The quotes broke through a powerful resistance zone. Before continuing the rise, the price needs to consolidate at the achieved level, forming a corrective segment.
Forecast:
At the beginning of the upcoming week, a sideways flat along the boundaries of the support zone is the most probable scenario. Subsequently, conditions for reversal formation can be expected. The beginning of the rise is anticipated closer to the weekend.
Potential Reversal Zones
Resistance:
Support:
Recommendations:
Selling: conditions for such transactions will be absent in the upcoming week.
Buying: may be used for trading transactions after confirmed reversal signals appear in the support zone.
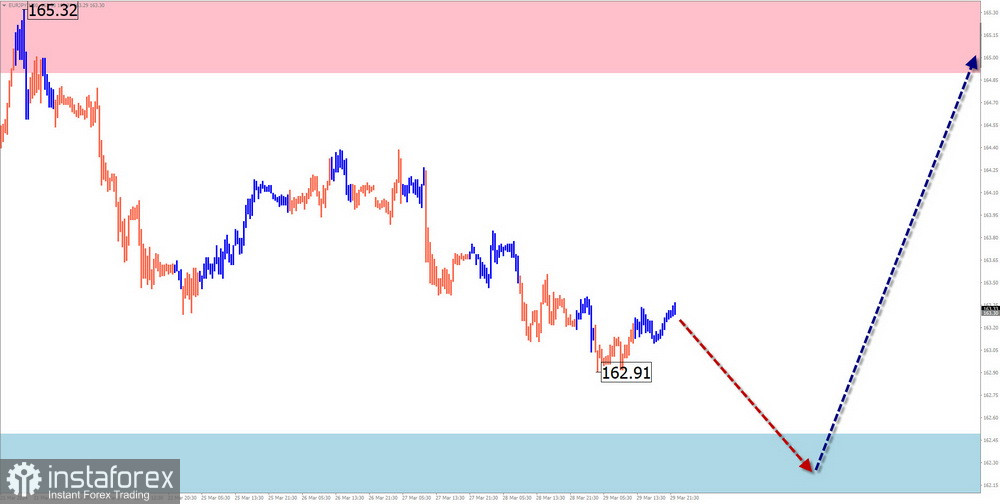
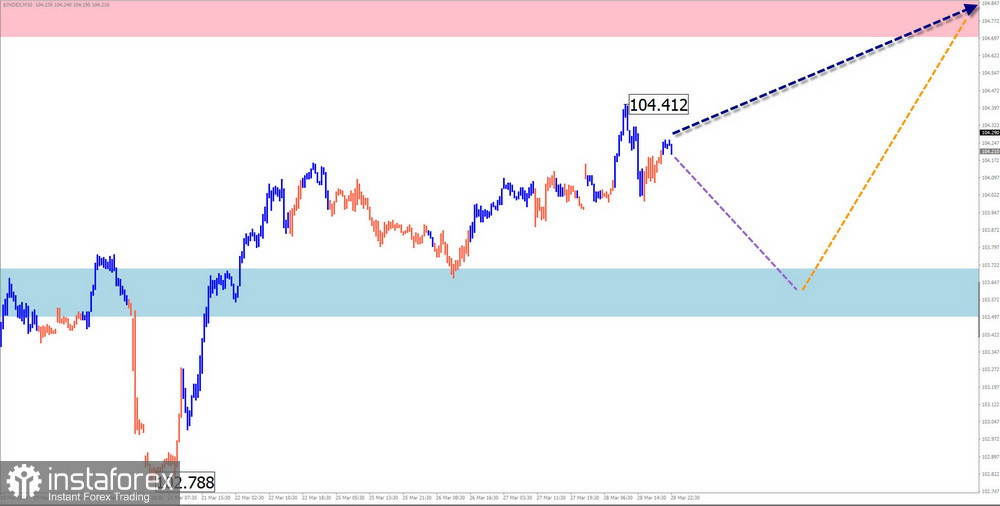
EUR/JPY
Analysis:
The global trend continues to drive the quotes of the euro/Japanese yen cross "north" on the price chart. The price has reached the upper boundary of a powerful weekly support zone. The wave structure looks completed, but the chart does not observe immediate reversal signals.
Forecast:
During the upcoming week, a conclusion of the price decline and a transition to a sideways drift around the support area can be expected. Towards the end of the week, the probability of reversal formation and a resumption of the price rise increases.
Potential Reversal Zones
Resistance:
Support:
Recommendations:
Buying: premature until the end of the current wave and the appearance of reversal signals in the support zone.
Sales: possible with fractional lots within intraday trading.
EUR/CHF
Analysis:
Since December of the previous year, a bullish wave has been forming on the chart of the euro/Swiss franc cross. The pair's quotes have reached the boundary of a strong potential reversal zone. The wave structure indicates completion. Over the past two weeks, the pair's quotes have been corrected in a sideways plane. The wave level of this segment has reversal potential.
Forecast:
During the upcoming week, a continuation of the overall sideways movement of the cross can be expected. With a high probability, an upward vector in the first half of the week may switch to a downward one closer to the weekend. A breakthrough of the upper boundary of the resistance when changing direction is unlikely.
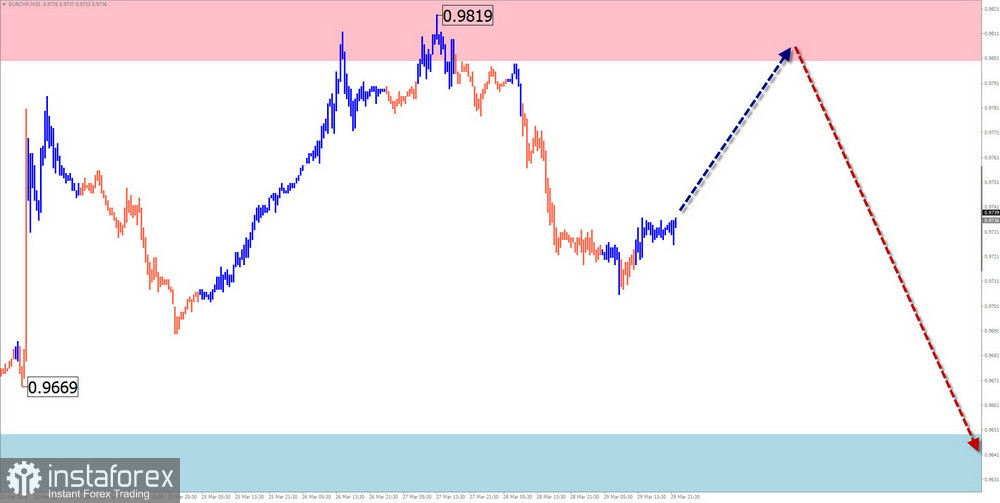
Potential Reversal Zones
Resistance:
Support:
Recommendations:
Buying: this can be done with fractional volumes within individual sessions.
Selling: conditions for such transactions are present once confirmed reversal signals appear in the resistance zone.
US dollar index
Analysis:
Since the end of December of the previous year, the quotes of the North American dollar index form an upward zigzag wave. The final part (C) started in the wave structure on March 11th. An intermediate retracement has formed in its structure over the past two weeks.
Forecast:
At the beginning of the upcoming week, a decrease in the rate to the boundaries of the calculated support zone is most likely. In the latter half, there is an increased chance of resuming the upward movement of the index. The resistance zone demonstrates the upper boundary of the expected weekly range.
Potential Reversal Zones
Resistance:
Support:
Recommendations:
The weakening of the position of the North American dollar will not last long. Transactions to weaken national currencies in major pairs should be opened upon confirmed reversal signals in the support zone.
Explanation: In simplified wave analysis (SWA), all waves consist of 3 parts (A-B-C). The latest, unfinished wave is analyzed on each timeframe. Dotted lines represent expected movements.
Attention: The wave algorithm does not consider the duration of instrument movements in time!
*The market analysis posted here is meant to increase your awareness, but not to give instructions to make a trade.
InstaSpot analytical reviews will make you fully aware of market trends! Being an InstaSpot client, you are provided with a large number of free services for efficient trading.


