


Our team has over 7,000,000 traders!
Every day we work together to improve trading. We get high results and move forward.
Recognition by millions of traders all over the world is the best appreciation of our work! You made your choice and we will do everything it takes to meet your expectations!
We are a great team together!
InstaSpot. Proud to work for you!


Actor, UFC 6 tournament champion and a true hero!
The man who made himself. The man that goes our way.
The secret behind Taktarov's success is constant movement towards the goal.
Reveal all the sides of your talent!
Discover, try, fail - but never stop!
InstaSpot. Your success story starts here!

EUR/USD
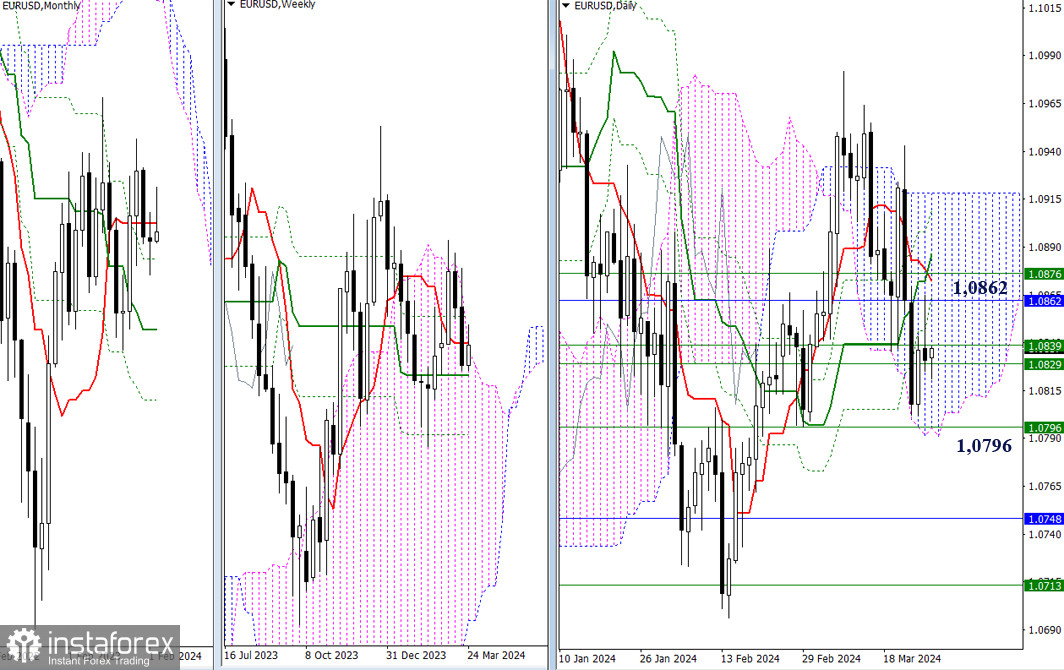
Higher Timeframes
Yesterday, the pair completed a retest of the monthly short-term trend (1.0862), and by the end of the trading day, it retraced back to the area of weekly supports (1.0829 – 1.0839). Consolidation is now a possibility. If the bears overcome the current attraction and influence of the weekly levels, then almost simultaneously with exiting the correction zone, they will need to break out of the daily cloud and surpass the weekly medium-term trend (1.0796).
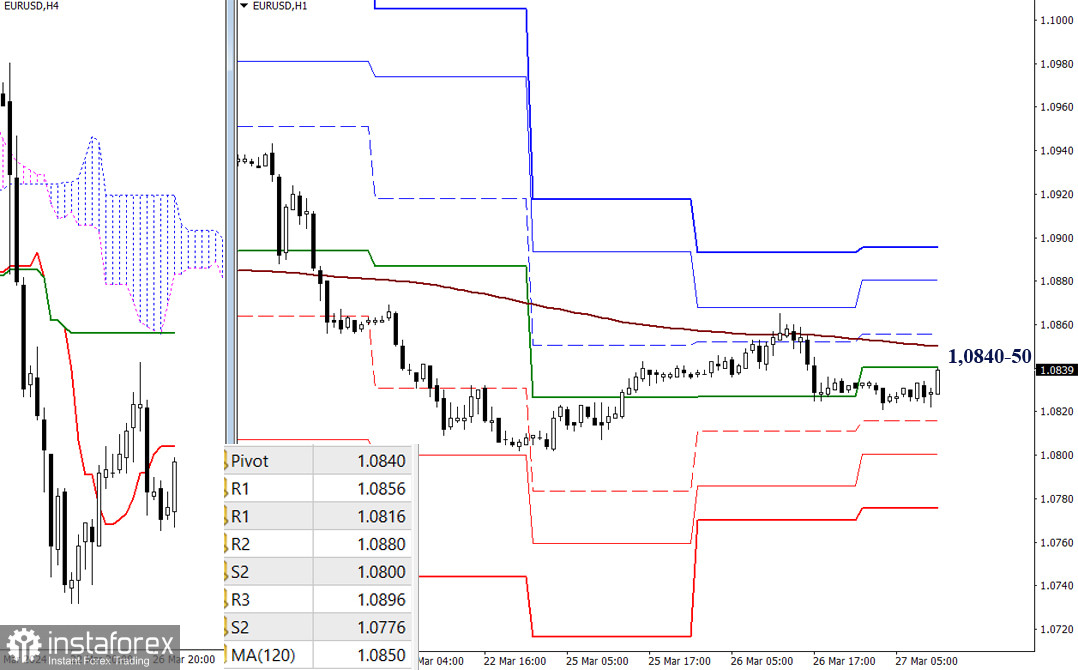
H4 - H1
On lower timeframes, bearish players continue to hold the upper hand. However, the upward correction has once again brought the pair to the resistances of key levels 1.0840-50 (central pivot point of the day + weekly long-term trend). A breakthrough and consolidation above may alter the current balance of power. The next targets for intraday ascent will be the resistances of classic pivot points (1.0856 - 1.0880 - 1.0896). The resumption of bearish activity will lead to testing the supports of classic pivot points (1.0816 - 1.0800 - 1.0776).
***
GBP/USD
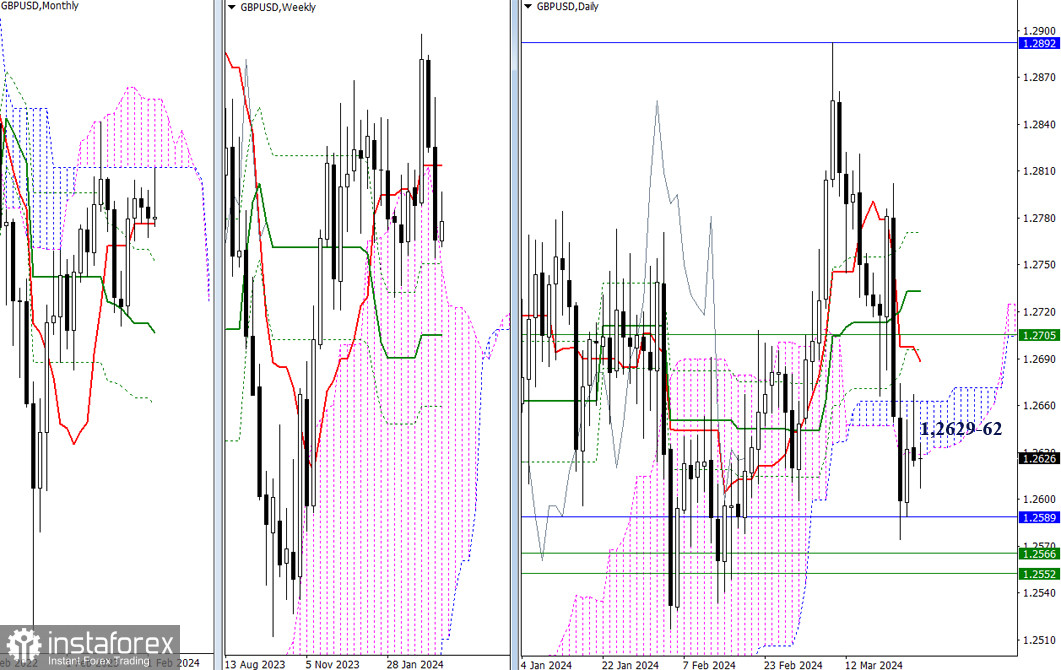
Higher Timeframes
The pound completed a retest of the daily Ichimoku cloud (1.2629-62). If bearish players manage to confirm and develop it, the next step will be a new attempt to test the support zone 1.2589 - 1.2566 - 1.2582, which combines monthly and weekly levels. If the bears fail to hold onto their gains, a new interaction with the daily cloud may end with its breakout and entry into the bullish zone. This would open new prospects at 1.2688 - 1.2705 - 1.2733 (daily cross levels + weekly short-term trend).
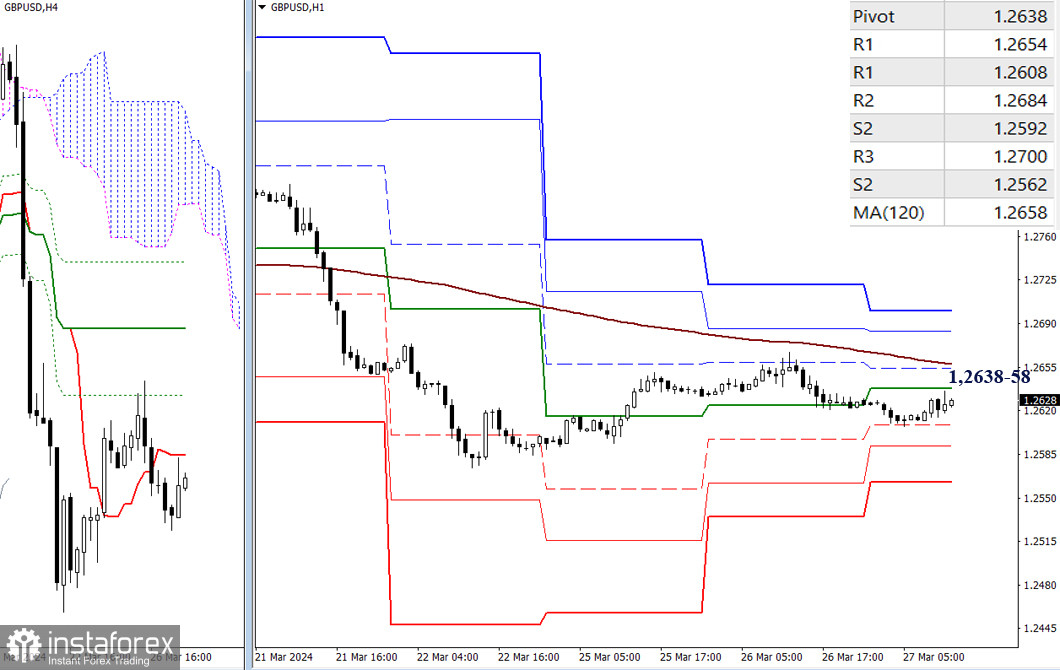
H4 - H1
During the last interaction with the weekly long-term trend, bearish players retained their advantage. A new upward movement is emerging, with a test of key levels approaching, which are currently located at the boundaries of 1.2638-58 (central pivot point of the day + weekly long-term trend). In case of a pullback and bearish activity, the market may utilize the supports of classic pivot points for downward movement (1.2608 - 1.2592 - 1.2562). Upon breakout (1.2658) and continuation of the upward movement, bulls can expect encounters with the resistances of classic pivot points (1.2684 - 1.2700) within the day.
***
The technical analysis of the situation uses:
Higher timeframes - Ichimoku Kinko Hyo (9.26.52) + Fibonacci Kijun levels
Lower timeframes - H1 - Pivot Points (classic) + Moving Average 120 (weekly long-term trend)
*The market analysis posted here is meant to increase your awareness, but not to give instructions to make a trade.
InstaSpot analytical reviews will make you fully aware of market trends! Being an InstaSpot client, you are provided with a large number of free services for efficient trading.


