


Our team has over 7,000,000 traders!
Every day we work together to improve trading. We get high results and move forward.
Recognition by millions of traders all over the world is the best appreciation of our work! You made your choice and we will do everything it takes to meet your expectations!
We are a great team together!
InstaSpot. Proud to work for you!


Actor, UFC 6 tournament champion and a true hero!
The man who made himself. The man that goes our way.
The secret behind Taktarov's success is constant movement towards the goal.
Reveal all the sides of your talent!
Discover, try, fail - but never stop!
InstaSpot. Your success story starts here!

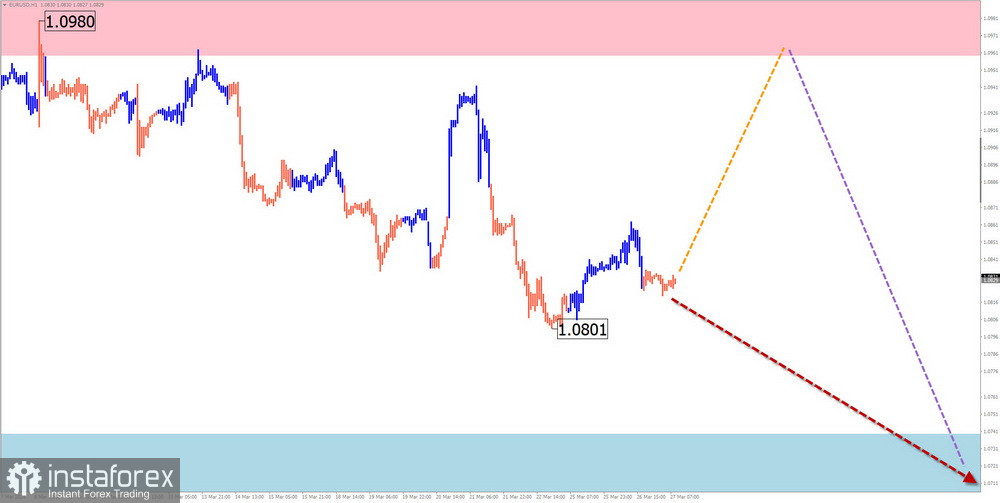
EUR/USD
Analysis:
Quotes of the main euro pair continue the downward trend that began in July of last year. Since the end of December, the price has been forming a corrective flat correction. As of today, there is no final part in the wave structure. Support runs along the lower edge of a powerful potential reversal zone.
Forecast:
Next week, the continuation of the overall flat movement of the euro between the nearest zones of counter-direction is expected. An upward vector is more likely at the beginning of the week. Further, the price is expected to experience corrective declines down to the calculated support. After that, one can expect a resumption of price growth.
Potential reversal zones:
Resistance:
Support:
Recommendations:
Buying: fractional volumes can be used within individual sessions.
Selling: risky before reversal signals appear around the resistance area and can harm the deposit.
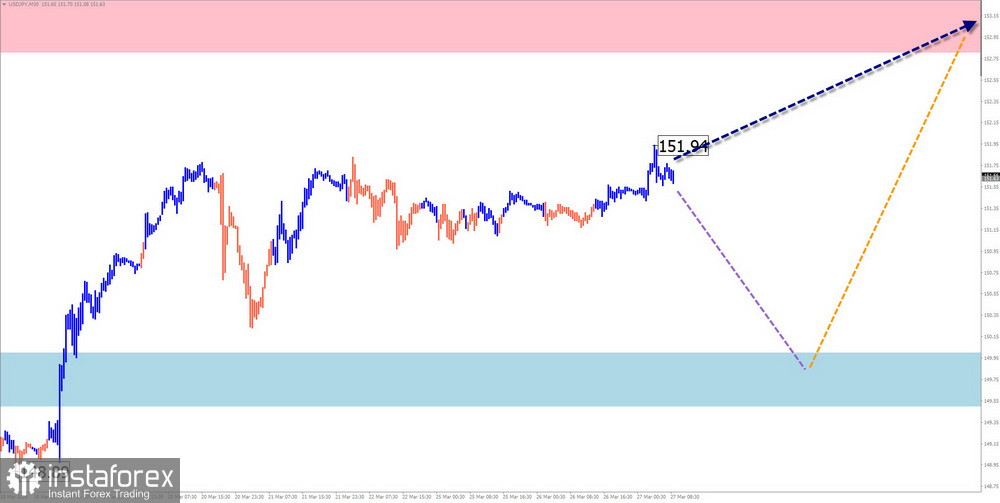
USD/JPY
Analysis:
On the chart of the major Japanese yen, the direction of the short-term trend coincides with the global trend. Since July of last year, the rate has set the algorithm of a bullish wave. On March 8, the last unfinished section started. The price has been corrected in a sideways flat in the last week. The structure of this wave section at the time of analysis does not show completeness.
Forecast:
A price decrease to the support zone can be expected in the next couple of days. Further, a reversal formation is likely. A change in direction can be expected closer to the weekend, against the background of increased volatility. The resumption of the upward course of movement is expected not higher than the resistance zone.
Potential reversal zones:
Resistance:
Support:
Recommendations:
Selling: possible with fractional volumes within intraday trading, with potential not below the calculated support.
Buying: this can be used to trade with fractional volumes after confirmed reversal signals.
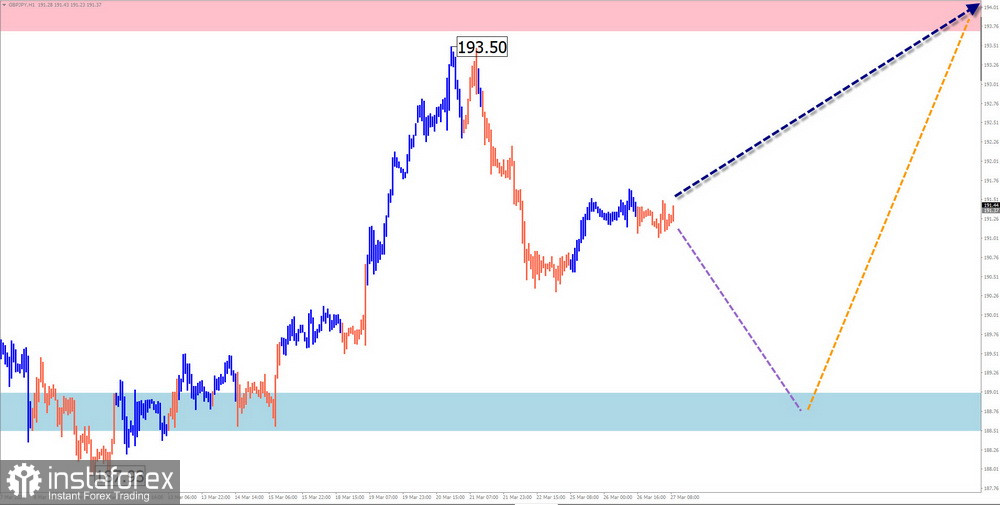
GBP/JPY
Analysis:
The algorithm of an ascending wave determines the fluctuations of the pound/yen pair in the short term since December of last year. In the structure of the last 2 months, the average part of the wave zigzag (B) is formed. The pair quotes are squeezed in a narrow price channel, limited by strong potential reversal zones of different scales.
Forecast:
A sideways movement can be expected at the beginning of the current week. A decrease in quotes to the support zone is possible. Closer to the weekend, an increase in volatility, a reversal, and a resumption of upward movement are more likely. The calculated resistance indicates the upper boundary of the expected weekly movement.
Potential reversal zones:
Resistance:
Support:
Recommendations:
Selling: has limited potential. Deals should be closed at the first signs of reversal.
Buying: after confirmed signals on your trading system, it can make trading deals.
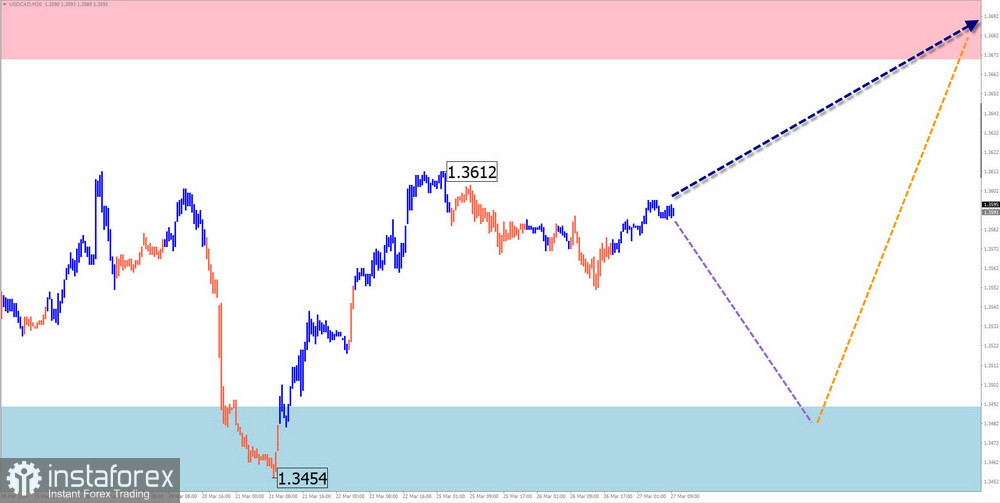
USD/CAD
Analysis:
On the chart of the main Canadian dollar pair, an unfinished upward wave model is being formed. It has been counting since December of last year. In the wave structure, the average corrective part (B) is nearing completion. The price entered the boundaries of a powerful resistance zone of a large timeframe. The downward section since March 10 has reversal potential. If confirmed, it will be the beginning of a new downward wave.
Forecast:
After a likely flat, there is a probability of a decrease in quotes to the support zone. Towards the end of the week, the chance of resuming the bullish course of movement increases up to the boundaries of the calculated resistance.
Potential reversal zones:
Resistance:
Support:
Recommendations:
Buying: premature until confirmed signals of reversal appear around the support zone.
Selling: carries a high degree of risk. It is recommended to minimize the volume size and close deals at the first signs of reversal.
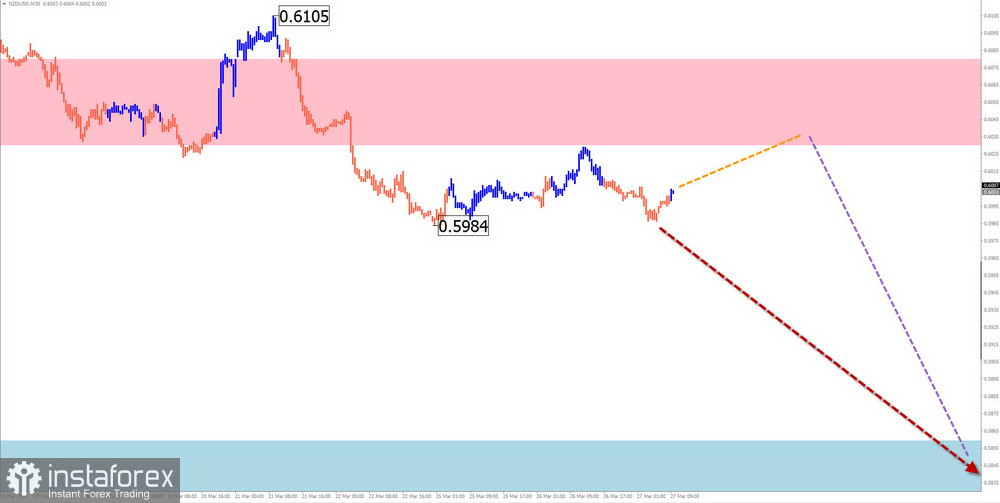
NZD/USD
Analysis:
The New Zealand dollar continues its downward movement within the unfinished descending wave construction that started last July. The wave structure analysis shows the final part (C) formation. The price broke through a strong support zone, which has become resistance.
Forecast:
A continuation of the price decline from the resistance zone to the calculated support zone is expected throughout the upcoming weekly period. Short-term pressure on the resistance zone will not be ruled out in the coming days.
Potential reversal zones:
Resistance:
Support:
Recommendations:
Buying: has no potential and may lead to losses.
Sellsingbecome relevant after confirmed signals of reversal appear around the resistance zone of your used trading systems.
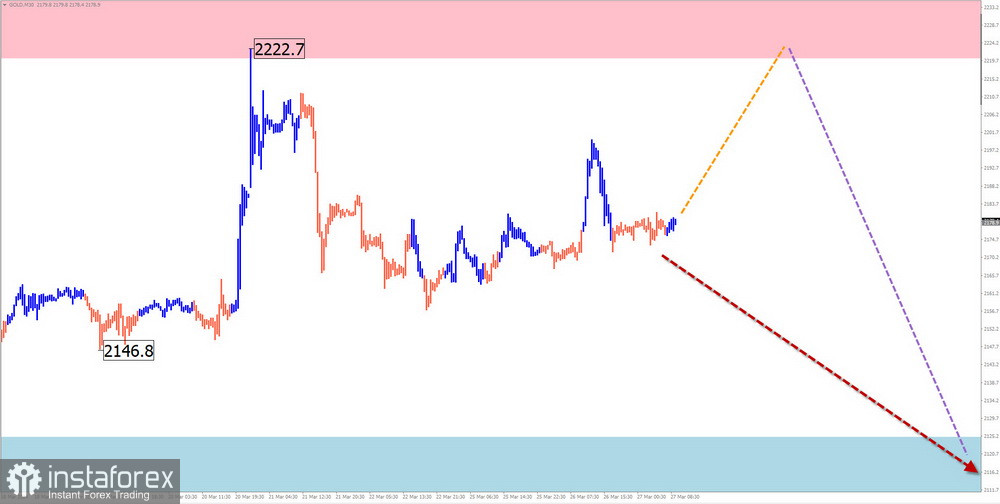
Gold
Analysis:
On the gold chart, quotes reached the lower boundary of the weekly scale chart's powerful potential reversal zone. The structure of the dominant upward wave since October of last year looks complete. Since March 21, the quotes have formed a downward wave with reversal potential. If confirmed, it will mark the start of a new short-term trend.
Forecast:
In the upcoming weekly period, the completion of the price rise, the formation of a reversal around the resistance zone, and the resumption of the price downward movement are expected. The calculated support demonstrates the lower boundary of the instrument's weekly movement range.
Potential reversal zones:
Resistance:
Support:
Recommendations:
Buying: can be used within individual sessions with reduced volumes. The calculated resistance limits the potential for upward movement.
Selling: this becomes relevant after confirmed reversal signals appear around the resistance zone.
Explanation: In simplified wave analysis (SWA), all waves consist of 3 parts (A-B-C). On each timeframe, the last unfinished wave is analyzed. Dotted lines indicate expected movements.
Attention: wave analysis does not consider the duration of movements in time!
*The market analysis posted here is meant to increase your awareness, but not to give instructions to make a trade.
InstaSpot analytical reviews will make you fully aware of market trends! Being an InstaSpot client, you are provided with a large number of free services for efficient trading.


