


Our team has over 7,000,000 traders!
Every day we work together to improve trading. We get high results and move forward.
Recognition by millions of traders all over the world is the best appreciation of our work! You made your choice and we will do everything it takes to meet your expectations!
We are a great team together!
InstaSpot. Proud to work for you!


Actor, UFC 6 tournament champion and a true hero!
The man who made himself. The man that goes our way.
The secret behind Taktarov's success is constant movement towards the goal.
Reveal all the sides of your talent!
Discover, try, fail - but never stop!
InstaSpot. Your success story starts here!

EUR/USD traded marginally lower on Tuesday. For the second day in a row, the pair's volatility did not exceed 40 pips, but we already warned you that this week volatility could sharply decrease compared to last week's values. Last week, there were two central bank meetings, as well as the UK inflation report. Of course, volatility was above average on Wednesday, Thursday, and Friday. But this week, there were practically no significant events on Monday and Tuesday...
The US released a report on durable goods orders. Despite the fact that it exceeded the forecast value, we did not see any particular market reaction to this report. The dollar rose during the US trading session, but this was not provoked by economic reports. We believe that the market will continue to trade smoothly, and the euro will gradually depreciate against the dollar. The problem with the euro is that the Federal Reserve may continue to postpone the timing of the first interest rate cut. At the same time, there is a 90% probability that the European Central Bank will ease monetary policy as early as June. This factor should stimulate the market to buy the US currency.
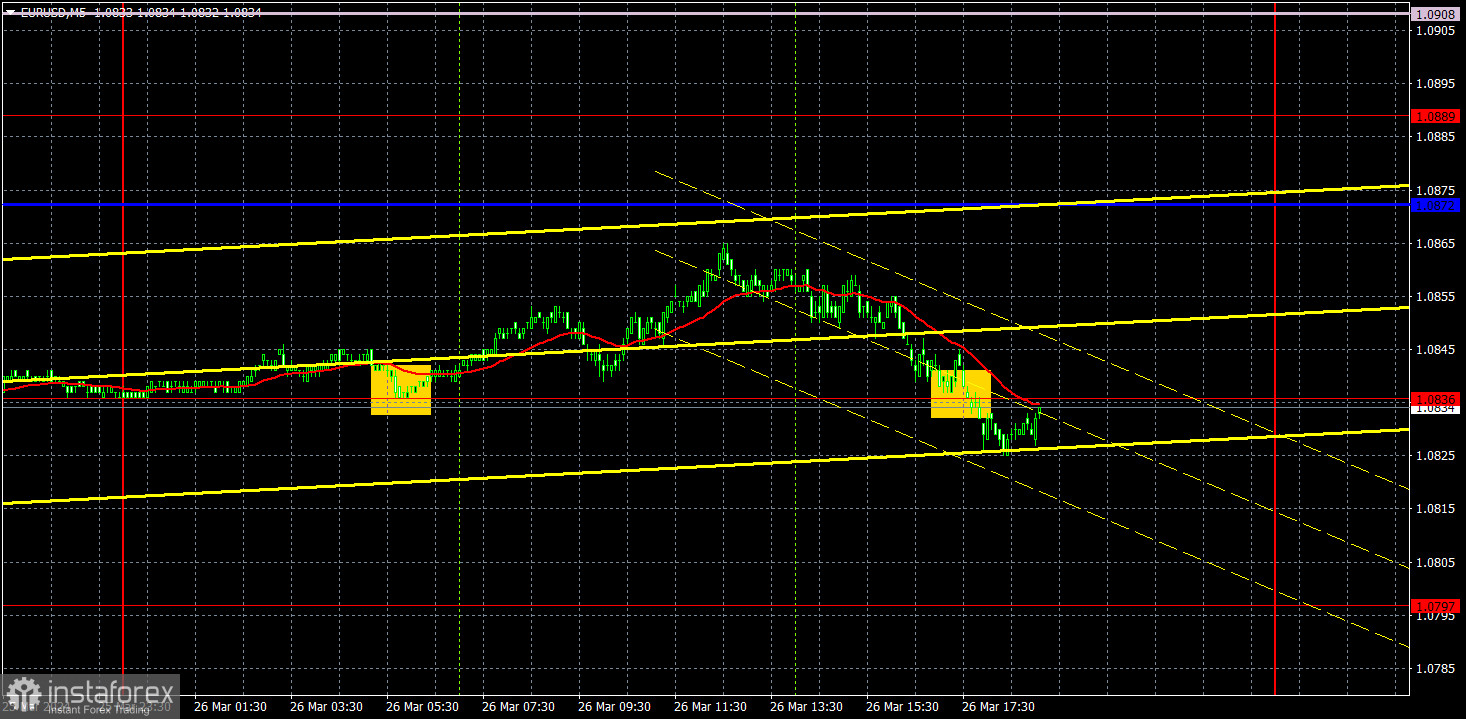
Speaking of trading signals, two of them were formed yesterday. Early in the morning, the pair rebounded from the level of 1.0836, but traders couldn't even make profit using such a perfect signal. This was because volatility was extremely low again, and the price simply failed to reach the nearest target line — the Kijun-sen. In the afternoon, the pair consolidated below the level of 1.0836, but it also did not bring any profit to traders.
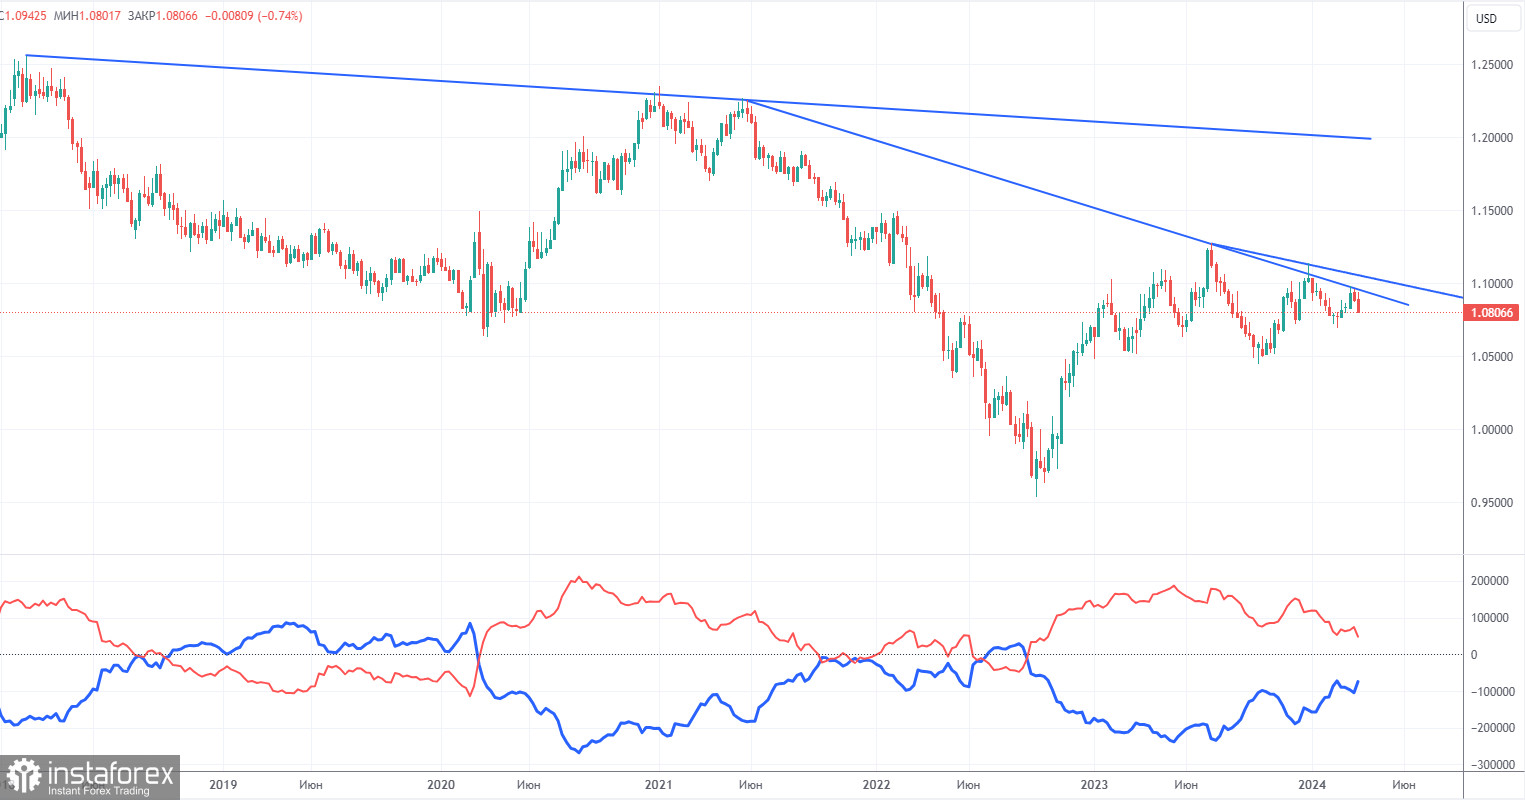
The latest COT report is dated March 19. The net position of non-commercial traders has been bullish for quite some time. Basically, the number of long positions in the market is higher than the number of short positions. However, at the same time, the net position of non-commercial traders has been decreasing in recent months, while that of commercial traders has been increasing. This shows that market sentiment is turning bearish, as speculators increase the volume of short positions on the euro. We don't see any fundamental factors that can support the euro's growth in the long term, while technical analysis also suggests a downtrend. Three descending trend lines on the weekly chart indicate that there's a good chance of extending the decline.
At present, the red and blue lines are moving towards each other (indicating a trend reversal after a rise). Therefore, we believe that the euro will fall further. During the last reporting week, the number of long positions for the non-commercial group decreased by 11,600, while the number of short positions increased by 14,400. Accordingly, the net position decreased by 26,000. The number of buy contracts is still higher than the number of sell contracts among non-commercial traders by 48,000 (previously 74,000).
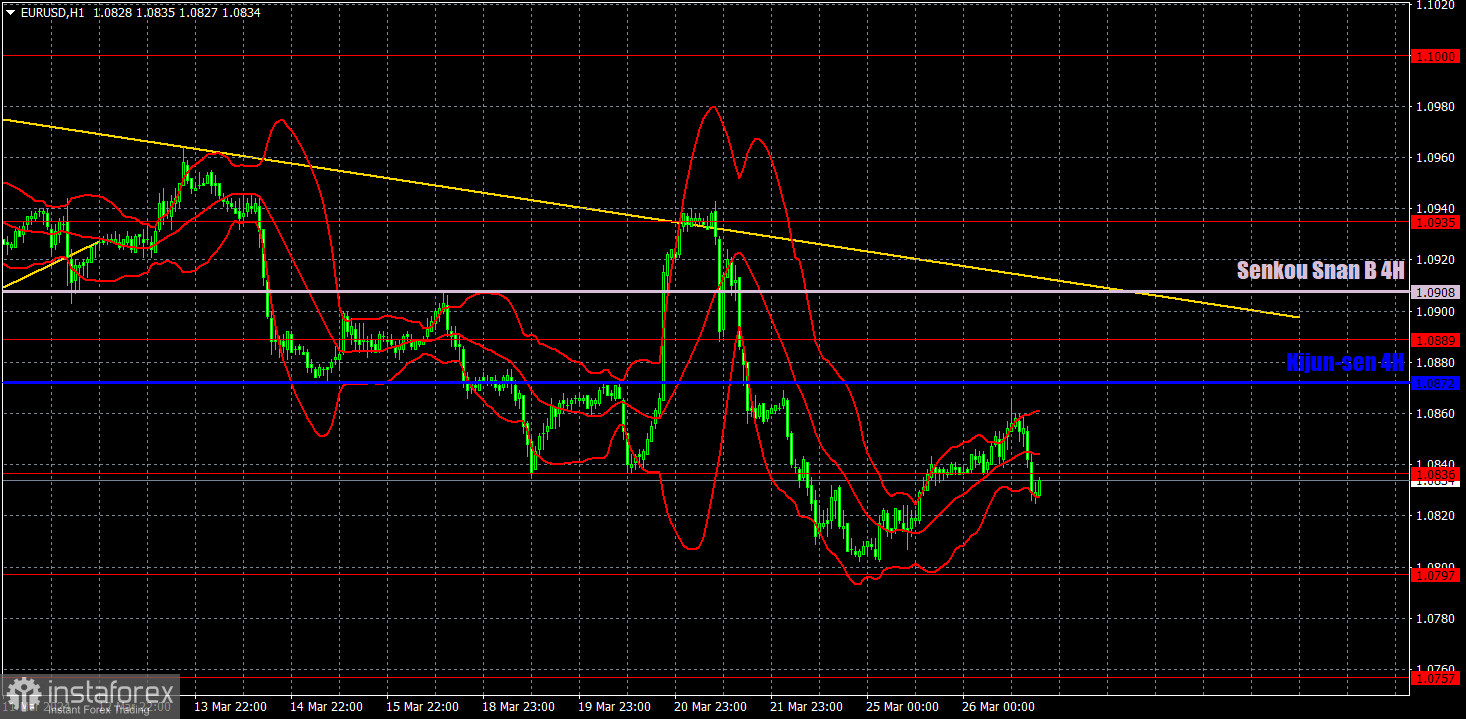
On the 1-hour chart, EUR/USD continues the long-awaited downtrend, which should pull it far down. The price is below the Ichimoku indicator lines, which gives us reason to expect further downward movement. The descending trendline also supports sellers. The dollar should still rise in almost any case, as the overall fundamental background is on its side. And especially after the Fed maintained its hawkish stance.
On March 27, we highlight the following levels for trading: 1.0530, 1.0581, 1.0658-1.0669, 1.0757, 1.0797, 1.0836, 1.0889, 1.0935, 1.1006, 1.1092, as well as the Senkou Span B line (1.0908) and the Kijun-sen (1.0872) lines. The Ichimoku indicator lines can move during the day, so this should be taken into account when identifying trading signals. Don't forget to set a Stop Loss to breakeven if the price has moved in the intended direction by 15 pips. This will protect you against potential losses if the signal turns out to be false.
On Wednesday, there are no scheduled events or even minor ones in both the US and the euro area. If the pair's volatility did not exceed 40-42 pips on Monday and Tuesday, then what can we possibly expect from a completely "empty" Wednesday? We'll most likely see unappealing movements again, and it will be very difficult to make profit.
Support and resistance levels are thick red lines near which the trend may end. They do not provide trading signals;
The Kijun-sen and Senkou Span B lines are the lines of the Ichimoku indicator, plotted to the 1H timeframe from the 4H one. They provide trading signals;
Extreme levels are thin red lines from which the price bounced earlier. They provide trading signals;
Yellow lines are trend lines, trend channels, and any other technical patterns;
Indicator 1 on the COT charts is the net position size for each category of traders;
Indicator 2 on the COT charts is the net position size for the Non-commercial group.
*The market analysis posted here is meant to increase your awareness, but not to give instructions to make a trade.
InstaSpot analytical reviews will make you fully aware of market trends! Being an InstaSpot client, you are provided with a large number of free services for efficient trading.


