


Our team has over 7,000,000 traders!
Every day we work together to improve trading. We get high results and move forward.
Recognition by millions of traders all over the world is the best appreciation of our work! You made your choice and we will do everything it takes to meet your expectations!
We are a great team together!
InstaSpot. Proud to work for you!


Actor, UFC 6 tournament champion and a true hero!
The man who made himself. The man that goes our way.
The secret behind Taktarov's success is constant movement towards the goal.
Reveal all the sides of your talent!
Discover, try, fail - but never stop!
InstaSpot. Your success story starts here!

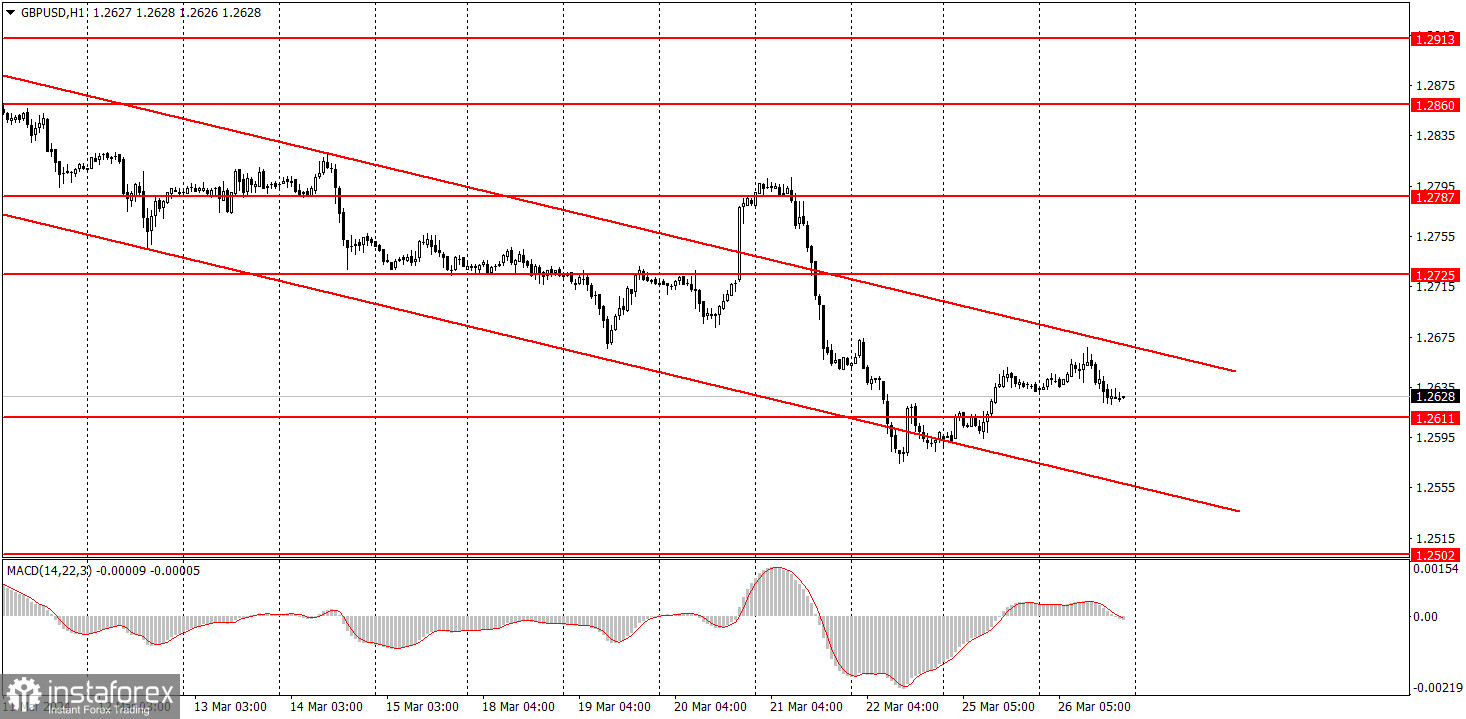
The GBP/USD pair tried to resume its downward movement, but volatility was so weak that it was hardly noticeable. Nevertheless, the descending channel remains relevant, and as long as the price stays within this area, we can expect the pound to fall further. The decline can be anticipated based on practically any type of analysis. On the hourly chart, the trend appears to be fairly strong. If we switch to the 24-hour timeframe, it becomes clear that the price has been within a range of about 300 pips for the past 4 months. Short-term trends alternate inside this range.
There were no important events or reports in the UK, and the market practically ignored the US report. If the price consolidates above the descending channel, this could signify a new attempt to start an upward movement. This scenario is possible even though the macroeconomic and fundamental backdrop continues to work in favor of the dollar.
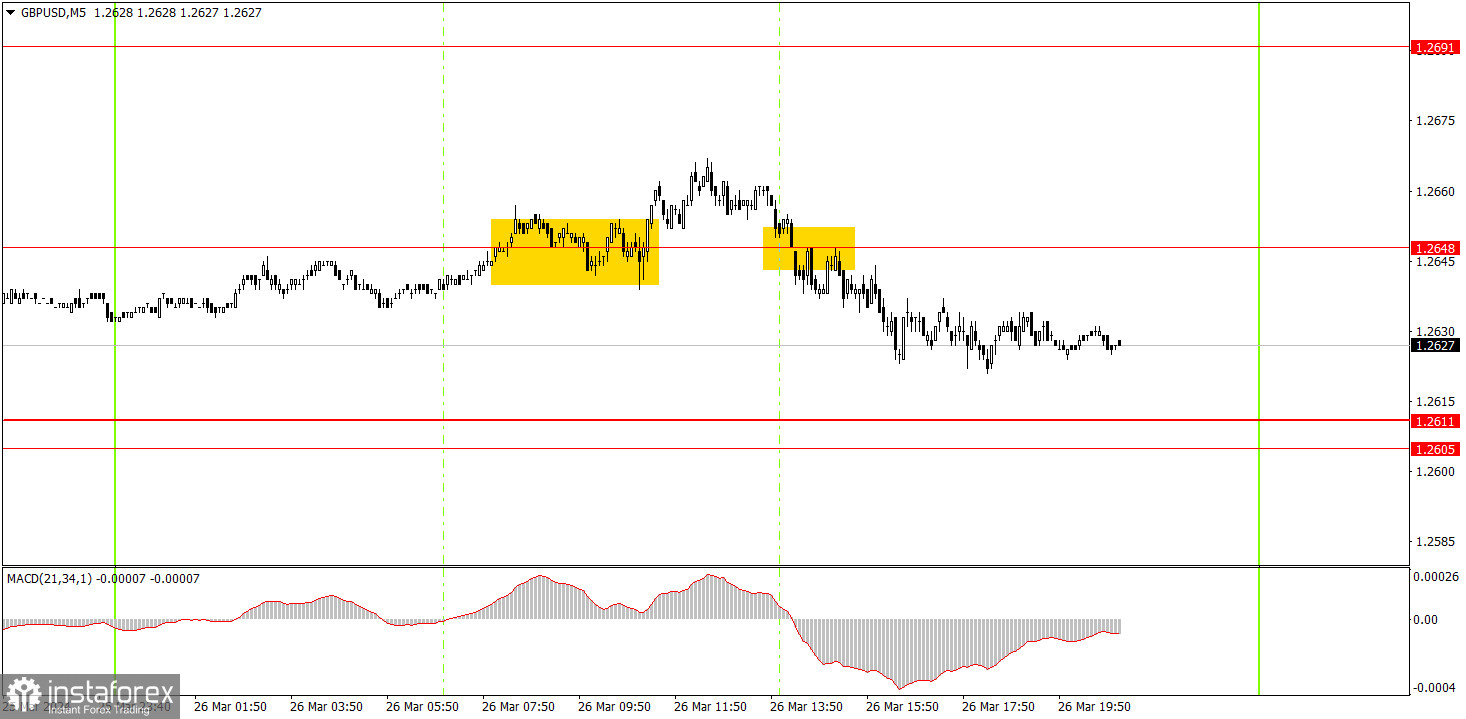
On the 5-minute timeframe, the price initially consolidated above the level of 1.2648, and then a couple of hours later, it moved below it. Thus, two signals were formed. The first buy signal did not bring any profit, and traders couldn't even set a stop loss to breakeven as the pair only rose by 10 pips. The second signal turned out to be slightly better, as the price moved in the intended direction by about 15 pips, making it possible to cover the loss from the first trade. However, overall, the nature of intraday movement remains unchanged - there was practically no volatility.
On the hourly chart, GBP/USD has resumed its downward movement. Unfortunately, the market continues to trade erratically or even sluggishly quite often, which at the very least confuses traders, especially beginners. Nevertheless, the British currency has been gradually declining, which is encouraging. The downtrend remains intact.
On Wednesday, you may consider short positions and wait for sell signals. You may disregard the bearish scenario in case the price consolidates above the descending channel. In this case, you may opt for longs, and expect a rise. However, in any case, movements will probably be weak.
The key levels on the 5M chart are 1.2372-1.2387, 1.2457, 1.2502, 1.2544, 1.2605-1.2611, 1.2648, 1.2691, 1.2725, 1.2787-1.2791, 1.2848-1.2860, 1.2913, 1.2981-1.2993. On Wednesday, there are no events or reports scheduled in both the UK and the US. It seems like another boring day.
1) Signal strength is determined by the time taken for its formation (either a bounce or level breach). A shorter formation time indicates a stronger signal.
2) If two or more trades around a certain level are initiated based on false signals, subsequent signals from that level should be disregarded.
3) In a flat market, any currency pair can produce multiple false signals or none at all. In any case, the flat trend is not the best condition for trading.
4) Trading activities are confined between the onset of the European session and mid-way through the U.S. session, after which all open trades should be manually closed.
5) On the 30-minute timeframe, trades based on MACD signals are only advisable amidst substantial volatility and an established trend, confirmed either by a trendline or trend channel.
6) If two levels lie closely together (ranging from 5 to 15 pips apart), they should be considered as a support or resistance zone.
Support and Resistance price levels can serve as targets when buying or selling. You can place Take Profit levels near them.
Red lines represent channels or trend lines, depicting the current market trend and indicating the preferable trading direction.
The MACD(14,22,3) indicator, encompassing both the histogram and signal line, acts as an auxiliary tool and can also be used as a signal source.
Significant speeches and reports (always noted in the news calendar) can profoundly influence the price dynamics. Hence, trading during their release calls for heightened caution. It may be reasonable to exit the market to prevent abrupt price reversals against the prevailing trend.
Beginners should always remember that not every trade will yield profit. Establishing a clear strategy coupled with sound money management is the cornerstone of sustained trading success.
*The market analysis posted here is meant to increase your awareness, but not to give instructions to make a trade.
InstaSpot analytical reviews will make you fully aware of market trends! Being an InstaSpot client, you are provided with a large number of free services for efficient trading.


