


Our team has over 7,000,000 traders!
Every day we work together to improve trading. We get high results and move forward.
Recognition by millions of traders all over the world is the best appreciation of our work! You made your choice and we will do everything it takes to meet your expectations!
We are a great team together!
InstaSpot. Proud to work for you!


Actor, UFC 6 tournament champion and a true hero!
The man who made himself. The man that goes our way.
The secret behind Taktarov's success is constant movement towards the goal.
Reveal all the sides of your talent!
Discover, try, fail - but never stop!
InstaSpot. Your success story starts here!

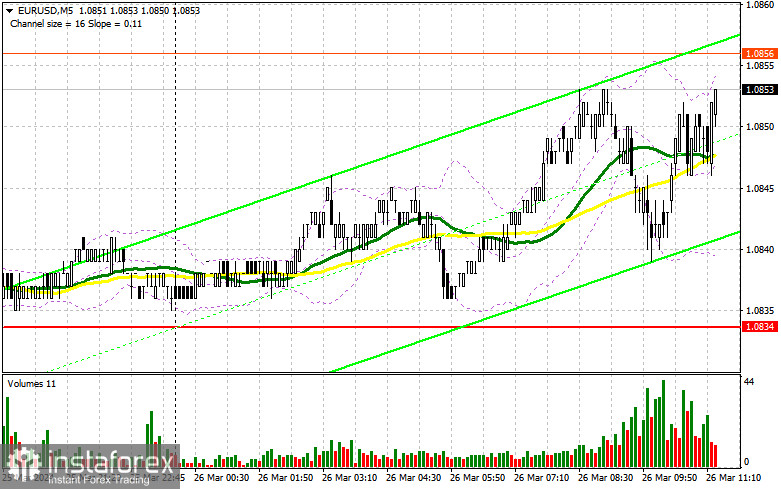
In my morning forecast, I focused on the level of 1.0834 and planned to base market entry decisions on it. Let's take a look at the 5-minute chart and analyze what happened there. There was a decline, but I never saw any false breakout formations. Therefore, suitable entry points into the market were not formed. The technical picture still needs to be revised for the second half of the day.
To open long positions on EUR/USD, the following is required:
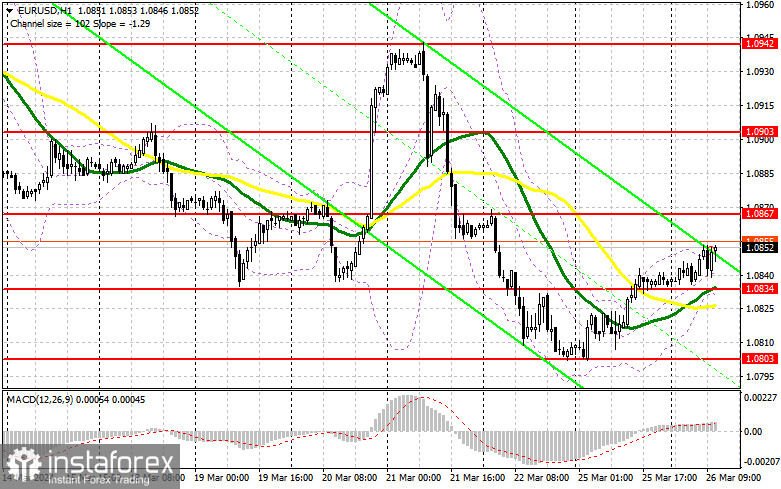
Ahead of us, there are quite interesting data on the American economy. Special attention should be paid to the figures on changes in durable goods orders, the housing price index, and the consumer confidence index. An increase in consumer confidence due to a stable economy may restore demand for the dollar, leading to a fairly decent decline in the pair. Therefore, it's optimal to follow the morning strategy: anticipating a decline and the emergence of a false breakout near the support level of 1.0834, established from yesterday's trading. This level coincides with the positioning of the moving averages, which also favor the bulls, presenting an opportunity to enter the market with a target for recovery of 1.0867. A breakout and renewal from top to bottom of this range against the backdrop of very weak statistics - another chance to buy with a maximum renewal of around 1.0903. The ultimate target will be the area of 1.0942, where I will make a profit. In the scenario of a decline in EUR/USD and the absence of activity at 1.0834 in the second half of the day, the chances of returning to the downtrend will increase. In this case, I will try to enter after the formation of a false breakout around the next support at 1.0803. I plan to open long positions immediately on the rebound from 1.0763, with a target of an upward correction of 30-35 points within the day.
To open short positions on EUR/USD, the following is required:
Sellers are taking a wait-and-see position and are likely to show themselves only after testing the resistance at 1.0867, where the pair is currently headed. Protection and the formation of a false breakout there, along with strong US data, will be a suitable scenario for opening short positions in the development of a downtrend with a targeted decline to the area of 1.0834. This level is very important for buyers, so only after breaking through and consolidating below this range, as well as a reverse test from bottom to top, do I expect to get another entry point for selling with an exit at 1.0803. The ultimate target will be a minimum of 1.0763, where I will take a profit. In case of further upward movement of EUR/USD in the second half of the day, as well as the absence of bears at 1.0867, buyers will try to continue the upward correction, aiming for a renewal of the maximum at 1.0903. I will act there only on a false breakout. I plan to open short positions immediately on the rebound from 1.0942, with a target of a downward correction of 30-35 points.
Indicator Signals:
Moving Averages
Trading is above the 30 and 50-day moving averages, indicating further pair growth.
Note: The period and prices of moving averages are considered by the author on the H1 hourly chart and differ from the general definition of classical daily moving averages on the D1 daily chart.
Bollinger Bands
In case of a decline, the lower boundary of the indicator, around 1.0834, will act as support.
Description of Indicators:
*The market analysis posted here is meant to increase your awareness, but not to give instructions to make a trade.
InstaSpot analytical reviews will make you fully aware of market trends! Being an InstaSpot client, you are provided with a large number of free services for efficient trading.


