


Our team has over 7,000,000 traders!
Every day we work together to improve trading. We get high results and move forward.
Recognition by millions of traders all over the world is the best appreciation of our work! You made your choice and we will do everything it takes to meet your expectations!
We are a great team together!
InstaSpot. Proud to work for you!


Actor, UFC 6 tournament champion and a true hero!
The man who made himself. The man that goes our way.
The secret behind Taktarov's success is constant movement towards the goal.
Reveal all the sides of your talent!
Discover, try, fail - but never stop!
InstaSpot. Your success story starts here!

The GBP/USD pair experienced a minor correction on Monday. It was for purely technical reasons, as there were no significant events in the UK. Meanwhile, Federal Reserve officials Austan Goolsbee and Raphael Bostic spoke, but their words were more likely to support the dollar than provoke its decline. Bostic reiterated his expectation for one interest-rate cut this year, as he noted that inflation was falling more slowly than anticipated. We believe this is another reason for the market to buy the dollar.
However, traders did not pay attention to his remarks. Nevertheless, it wouldn't be wise to draw loud conclusions based on just a day, but the fact remains: the market is still reluctant to sell the GBP/USD pair. Therefore, we wouldn't be surprised if the pair starts a new phase of growth at some point (in the medium term). For now, the price remains below all key lines and the trend line that we consider relevant, despite last week's breakout. This happened after the Fed meeting, and during such times, the market trades too impulsively and emotionally. Therefore, we do not even consider these movements.
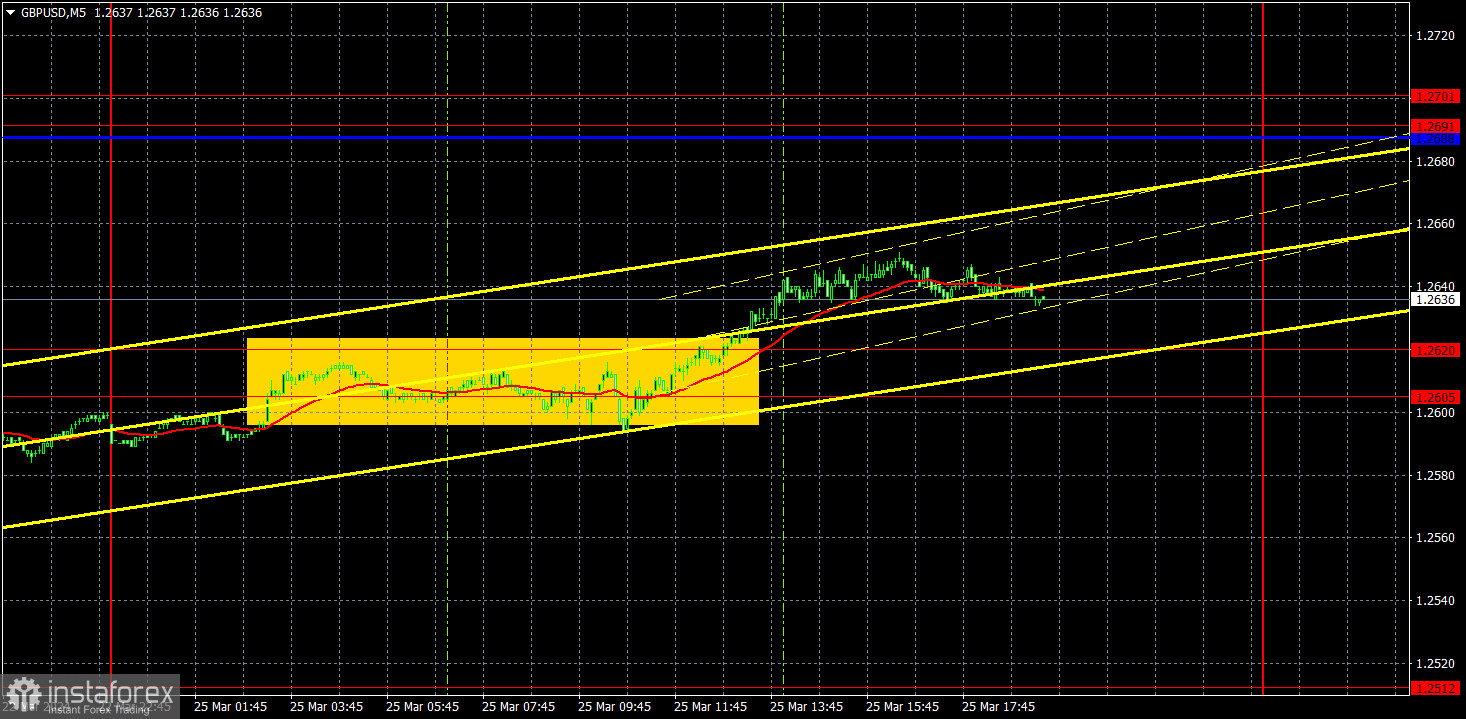
Speaking of trading signals, only one was formed on Monday. During the European session, after a long struggle, the pair broke through the 1.2605-1.2620 area, but naturally, it failed to show a meaningful upward movement. All the pound managed to do was a 20-pip increase. This was enough for traders to set Stop Loss to breakeven, but the trade could even be closed manually at a profit in the evening.
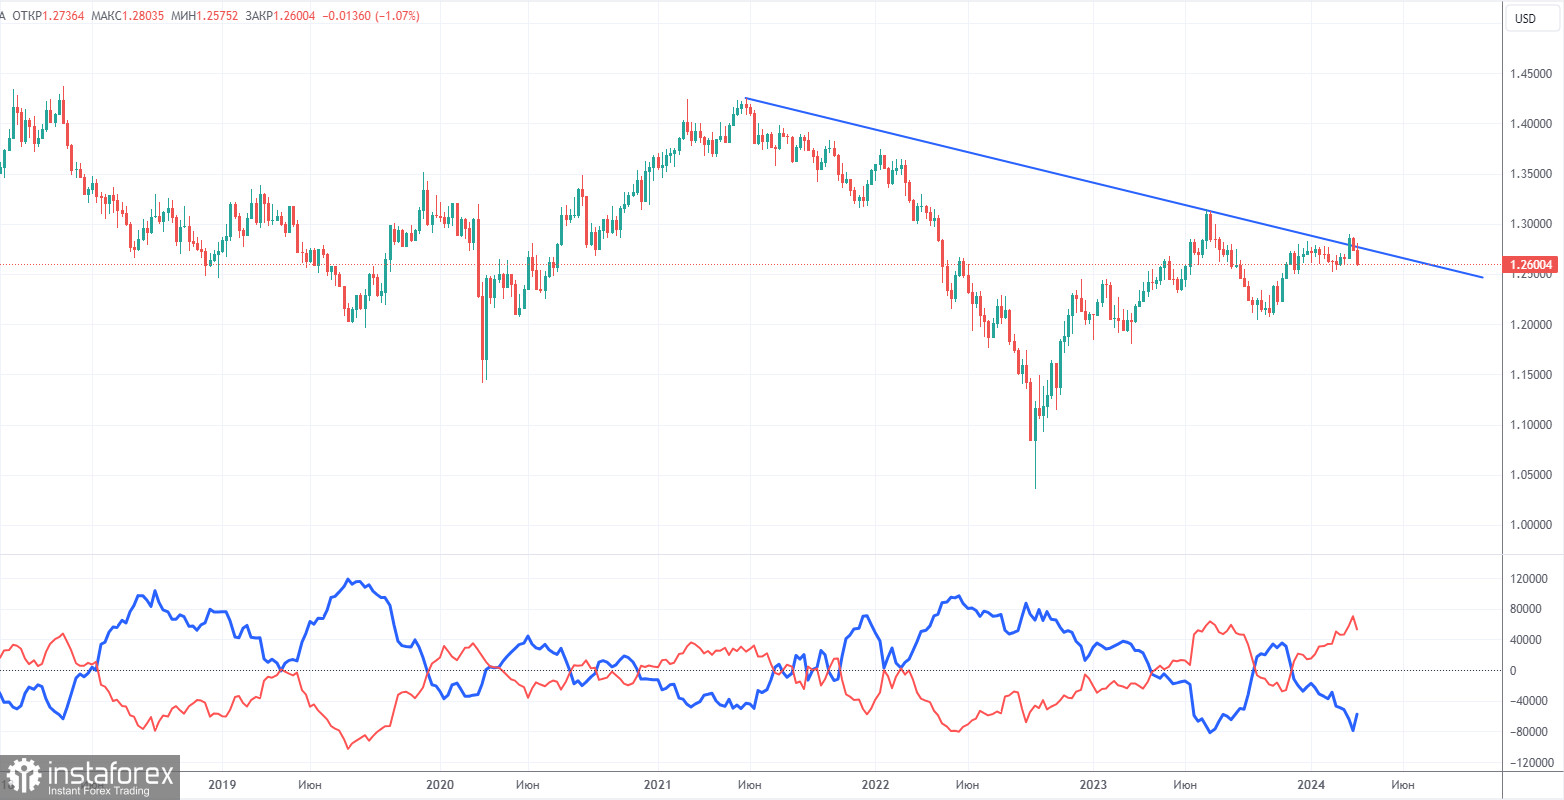
COT reports on the British pound show that the sentiment of commercial traders has frequently changed in recent months. The red and blue lines, which represent the net positions of commercial and non-commercial traders, constantly intersect and, in most cases, remain close to the zero mark. According to the latest report on the British pound, the non-commercial group closed 20,700 buy contracts and 3,400 short ones. As a result, the net position of non-commercial traders decreased by 17,300 contracts in a week. The fundamental background still does not provide a basis for long-term purchases of the pound sterling.
The non-commercial group currently has a total of 102,600 buy contracts and 49,400 sell contracts. The bulls have a big advantage. However, in recent months, we have repeatedly encountered the same situation: the net position either increases or decreases, and the bulls or the bears either have the advantage. Since the COT reports do not provide an accurate forecast of the market's behavior at the moment, we have to scrutinize the technical picture. The technical analysis suggests that there's a possibility that the pound could show a pronounced downward movement (descending trend line), and on the 24-hour timeframe, the price has dropped below the Ichimoku indicator lines.
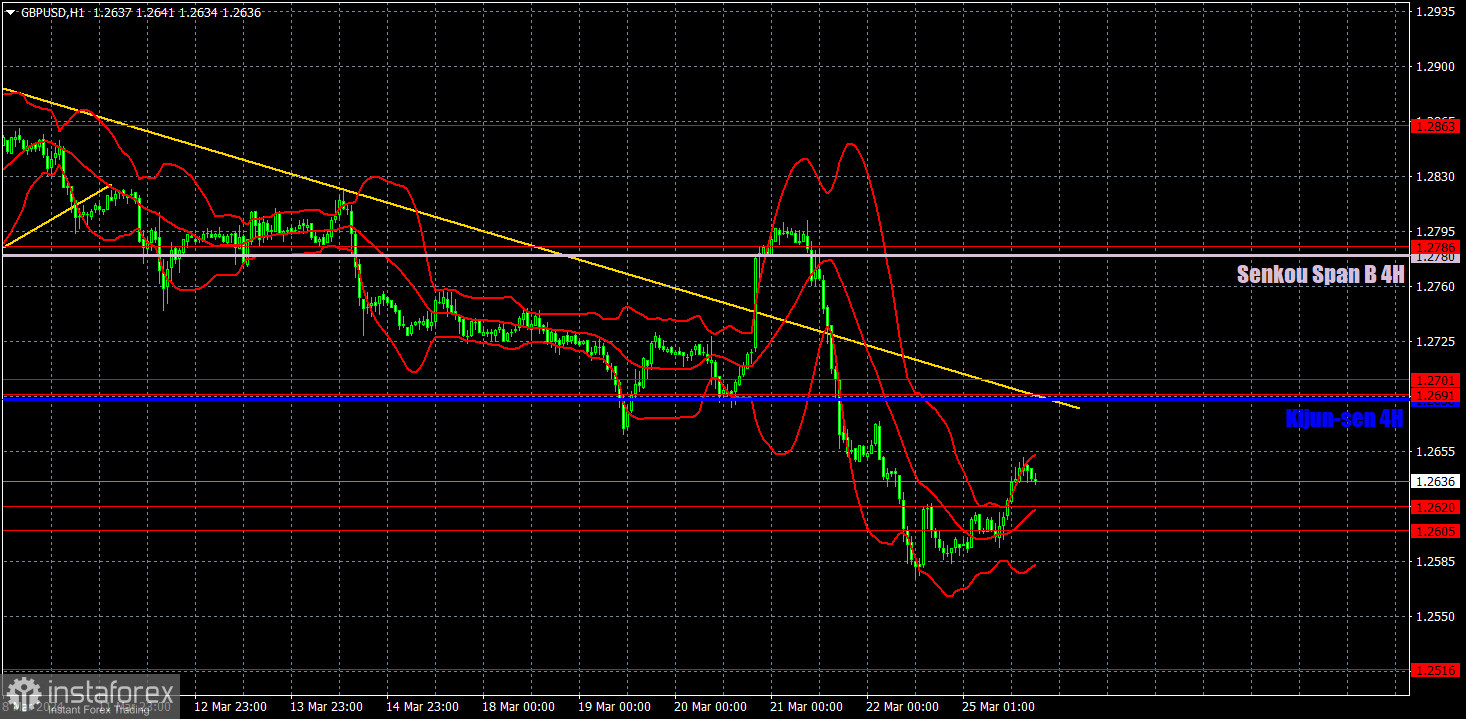
On the 1H chart, GBP/USD continues to form a new downtrend. The economic reports and the fundamental background do not support the British pound at all, and yet it is still reluctant to fall. We expect a firm downward movement, and the meetings of the Bank of England and the Federal Reserve have once again proven that there is no basis for the pound to rise against the dollar. The bearish bias persists below the trend line and below the Kijun-sen line.
As of March 26, we highlight the following important levels: 1.2215, 1.2269, 1.2349, 1.2429-1.2445, 1.2516, 1.2605-1.2620, 1.2691, 1.2786, 1.2863, 1.2981-1.2987. The Senkou Span B line (1.2780) and the Kijun-sen line (1.2688) can also serve as sources of signals. Don't forget to set a Stop Loss to breakeven if the price has moved in the intended direction by 20 pips. The Ichimoku indicator lines may move during the day, so this should be taken into account when determining trading signals.
On Tuesday, the UK event calendar is empty. Traders will be focusing on the US report on durable goods orders, which could provoke a strong market reaction if it provides a significant value. Even if it doesn't turn out in favor of the dollar, we still expect the dollar to rise. A flat is clearly visible on the 24-hour timeframe, and now a new phase of downward movement has begun.
Support and resistance levels are thick red lines near which the trend may end. They do not provide trading signals;
The Kijun-sen and Senkou Span B lines are the lines of the Ichimoku indicator, plotted to the 1H timeframe from the 4H one. They provide trading signals;
Extreme levels are thin red lines from which the price bounced earlier. They provide trading signals;
Yellow lines are trend lines, trend channels, and any other technical patterns;
Indicator 1 on the COT charts is the net position size for each category of traders;
Indicator 2 on the COT charts is the net position size for the Non-commercial group.
*The market analysis posted here is meant to increase your awareness, but not to give instructions to make a trade.
InstaSpot analytical reviews will make you fully aware of market trends! Being an InstaSpot client, you are provided with a large number of free services for efficient trading.


