


Our team has over 7,000,000 traders!
Every day we work together to improve trading. We get high results and move forward.
Recognition by millions of traders all over the world is the best appreciation of our work! You made your choice and we will do everything it takes to meet your expectations!
We are a great team together!
InstaSpot. Proud to work for you!


Actor, UFC 6 tournament champion and a true hero!
The man who made himself. The man that goes our way.
The secret behind Taktarov's success is constant movement towards the goal.
Reveal all the sides of your talent!
Discover, try, fail - but never stop!
InstaSpot. Your success story starts here!

In my morning forecast, I paid attention to the 1.2576 level and planned to decide to enter the market from it. Let's look at the 5-minute chart and figure out what happened there. The decline occurred, but it never reached the 1.2576 test. For this reason, obtaining suitable entry points into the market was impossible. In the afternoon, the technical picture was revised.
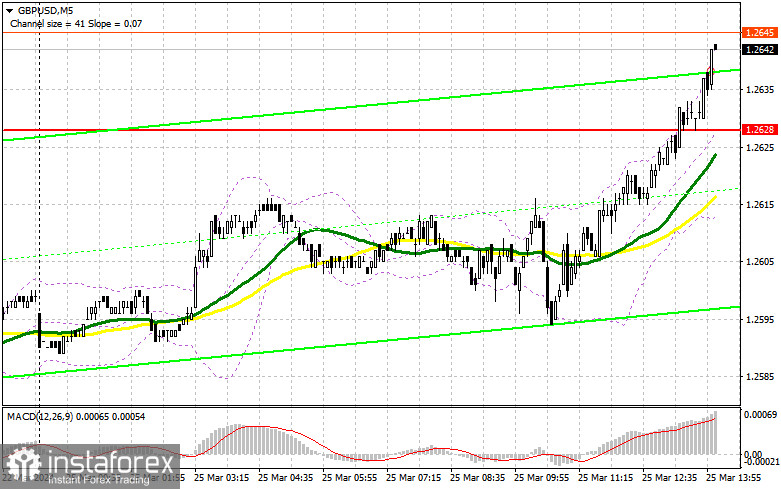
To open long positions on GBP/USD, it is required:
The pound may continue to correct, but this requires weak data on the volume of home sales in the primary market in the United States, as well as the soft tone of FOMC members Rafael Bostic and Lisa D. Cook. In the event of a decline in the pair after the speeches of the Fed representatives, only the formation of a false breakdown in the area of the nearest support of 1.2576 will give a suitable entry point into long positions, counting on the return of demand for the pound with the prospect of consolidation above 1.2628. A breakout and consolidation above this range will strengthen the bulls' position and open the way to 1.2673. The farthest goal will be a maximum of 1.2708, where I will fix the profit. In the scenario of a decline in the pair and a lack of activity on the part of the bulls at 1.2576, sellers will continue to control the market. In this case, only a false breakout in the area of the next support at 1.2535 will confirm the correct entry point into the market. I plan to buy GBP/USD immediately for a rebound from the minimum of 1.2507 to correct 30-35 points within the day.
To open short positions on GBP/USD, you need:
The bears are not very active yet. In case of further growth of the pair, only a false breakdown in the area of the new resistance of 1.2673 will confirm the correct entry point for sale in the continuation of the trend, which will lead to a downward movement to the area of 1.2628 – the level where the main trade is currently conducted. A breakout and a reverse test from the bottom up of this range will deal the mother-in-law one blow to the buyers' positions, leading to the demolition of stop orders and opening the way to 1.2576. The ultimate target will be the area of 1.2535, where profit will be taken. In the scenario of GBP/USD growth and a lack of activity at 1.2673 in the second half of the day, buyers will have a chance to build an upward correction at the beginning of the week. In this case, I will postpone selling until a false breakout at 1.2708. If there is no downward movement, I will sell GBP/USD immediately on the rebound from 1.2756, but only counting on a pair correction downward by 30-35 points within the day.
Indicator signals:
Moving averages
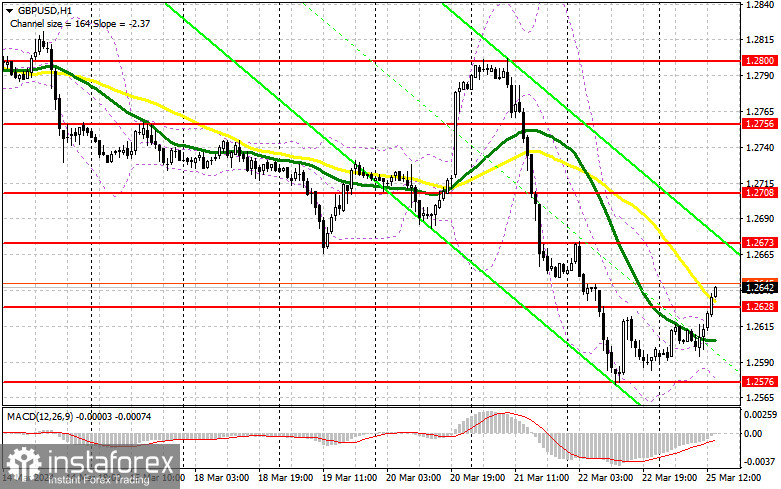
Trading is conducted below the 30 and 50-day moving averages, indicating further decline in the pair.
Note: The author considers the period and prices of moving averages on the H1 hourly chart, which differs from the general definition of classical daily moving averages on the D1 daily chart.
Bollinger Bands
In case of a decline, the lower boundary of the indicator will act as support around 1.2580.
Description of indicators:
• Moving average (determines the current trend by smoothing volatility and noise). Period 50. Marked in yellow on the chart.
• Moving average (determines the current trend by smoothing volatility and noise). Period 30. Marked in green on the chart.
• MACD indicator (Moving Average Convergence/Divergence — convergence/divergence of moving averages). Fast EMA period 12. Slow EMA period 26. SMA period 9.
• Bollinger Bands. Period 20.
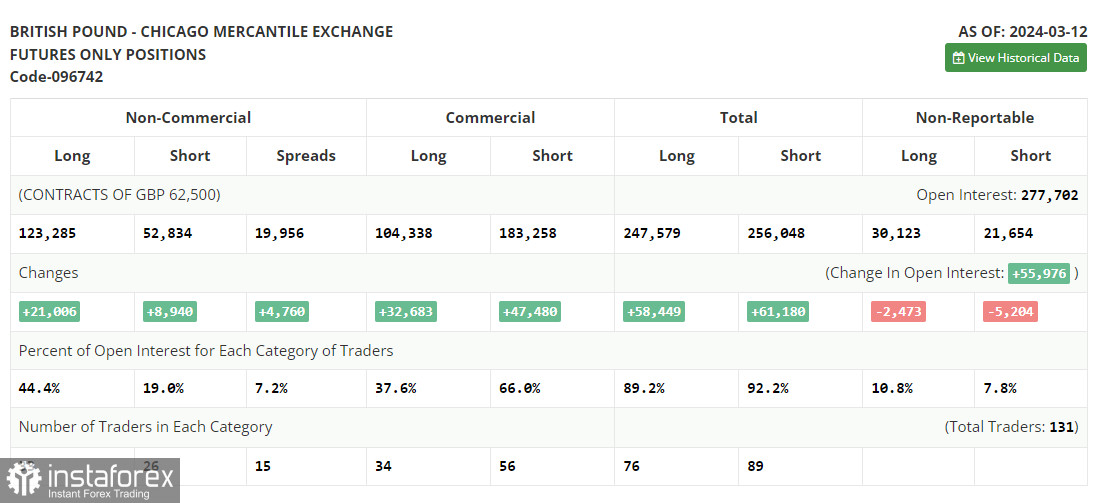
• Non-commercial traders - speculators, such as individual traders, hedge funds, and large institutions, use the futures market for speculative purposes and meet certain requirements.
• Long non-commercial positions represent the total long open positions of non-commercial traders.
• Short non-commercial positions represent the total short open positions of non-commercial traders.
• The net non-commercial position differs from non-commercial traders' short and long positions.
*The market analysis posted here is meant to increase your awareness, but not to give instructions to make a trade.
InstaSpot analytical reviews will make you fully aware of market trends! Being an InstaSpot client, you are provided with a large number of free services for efficient trading.


