


Our team has over 7,000,000 traders!
Every day we work together to improve trading. We get high results and move forward.
Recognition by millions of traders all over the world is the best appreciation of our work! You made your choice and we will do everything it takes to meet your expectations!
We are a great team together!
InstaSpot. Proud to work for you!


Actor, UFC 6 tournament champion and a true hero!
The man who made himself. The man that goes our way.
The secret behind Taktarov's success is constant movement towards the goal.
Reveal all the sides of your talent!
Discover, try, fail - but never stop!
InstaSpot. Your success story starts here!

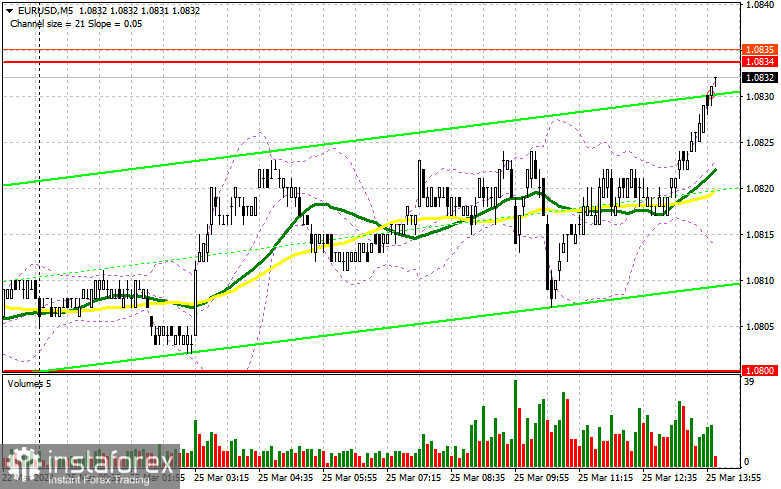
In my morning forecast, I highlighted the level of 1.0800 and planned to base market entry decisions on it. Let's look at the 5-minute chart and analyze what happened there. There was a decline, but I never witnessed the formation of a false breakout. As a result, suitable entry points into the market were not formed. The technical picture was reviewed for the second half of the day.
To open long positions on EUR/USD, the following is required:
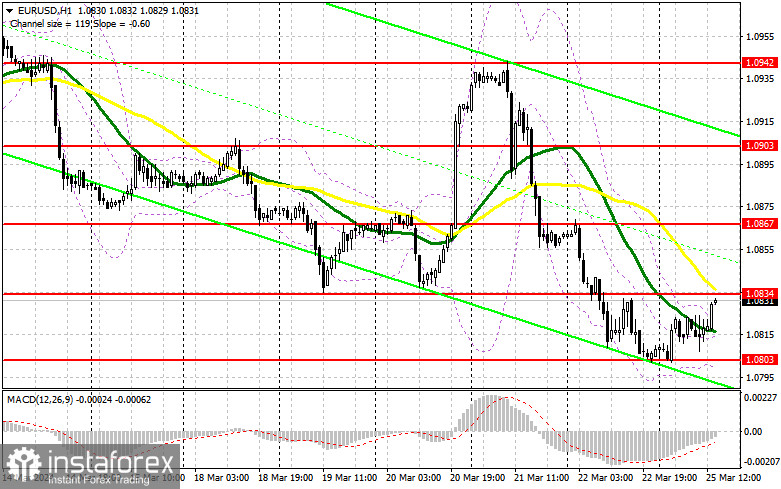
Ahead of us, we have quite interesting data regarding home sales volume in the primary market, and members of the FOMC, Raphael Bostic and Lisa D. Cook, are speaking. Their message about interest rate cuts will have quite a vivid tone, and if so, the pressure on the dollar may increase even more. With strong statistics and a firm stance from the Fed representatives, it is best to act on the decline after forming a false breakout around the support area of 1.0803. Only this option for purchases will be suitable, counting on a correction towards 1.0934 – resistance, where moving averages are located, favoring sellers. Breaking and updating this range from top to bottom will strengthen the pair, with a chance of a surge to 1.0867. The ultimate target will be a maximum of 1.0903, where I will take a profit. In the scenario of a decline in EUR/USD in the second half of the day and a lack of activity around 1.0803, pressure on the euro will only intensify, leading to further decline with the prospect of updating 1.0763. I plan to enter the market there only after the formation of a false breakout. I will consider opening long positions immediately on the rebound from 1.0735 with a target of a 30-35 point upward correction within the day.
To open short positions on EUR/USD, the following is required:
Sellers have remained, and despite the slight rise in the pair, there is no reason for panic yet. The focus is now on protecting the nearest resistance at 1.0834, where the formation of a false breakout will prove the presence of large sellers in the market and provide a good entry point into short positions with the prospect of updating the new support at 1.0803. Breaking and consolidating below this range and a reverse test from bottom to top will provide another selling point with a collapse of the pair towards 1.0763, where buyers will become more active. The ultimate target will be a minimum of 1.0735, where I will take a profit. In the scenario of an upward movement of EUR/USD in the second half of the day, as well as the absence of bears at 1.0834, buyers will have a chance to rise. In this case, I will postpone selling until testing the next resistance at 1.0867. I will also sell there, but only after an unsuccessful consolidation. I plan to open short positions immediately on the rebound from 1.0903 with a 30-35 point downward correction target.
Indicator signals:
Moving averages
Trading is conducted below the 30 and 50-day moving averages, indicating further decline in the pair.
Note: The author considers the period and prices of moving averages on the H1 hourly chart, which differs from the general definition of classical daily moving averages on the D1 daily chart.
Bollinger Bands
In case of a decline, the lower boundary of the indicator will act as support around 1.0800.
Description of indicators:
• Moving average (determines the current trend by smoothing volatility and noise). Period 50. Marked in yellow on the chart.
• Moving average (determines the current trend by smoothing volatility and noise). Period 30. Marked in green on the chart.
• MACD indicator (Moving Average Convergence/Divergence — convergence/divergence of moving averages). Fast EMA period 12. Slow EMA period 26. SMA period 9.
• Bollinger Bands. Period 20.
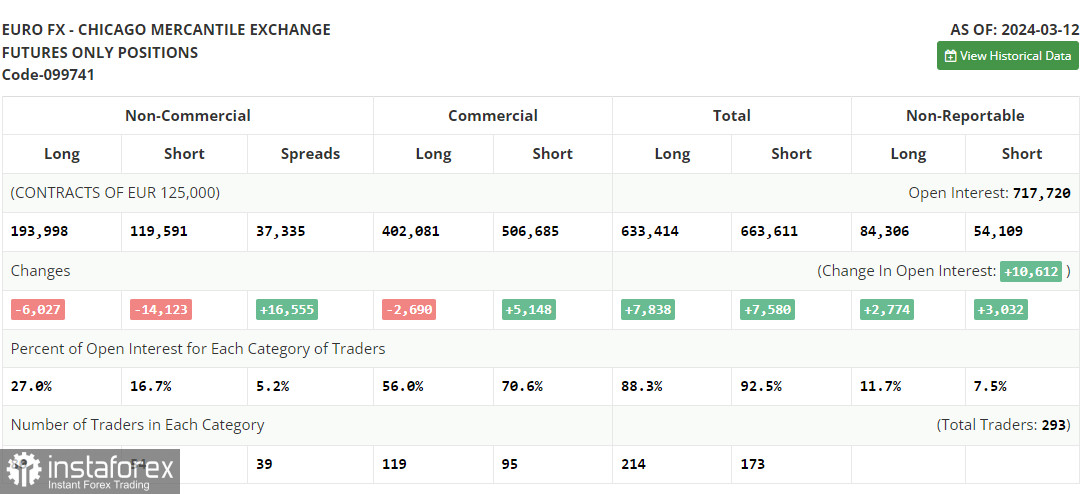
• Non-commercial traders - speculators, such as individual traders, hedge funds, and large institutions, using the futures market for speculative purposes and meeting certain requirements.
• Long non-commercial positions represent the total long open positions of non-commercial traders.
• Short non-commercial positions represent the total short open positions of non-commercial traders.
• The net non-commercial position is the difference between non-commercial traders' short and long positions.
*The market analysis posted here is meant to increase your awareness, but not to give instructions to make a trade.
InstaSpot analytical reviews will make you fully aware of market trends! Being an InstaSpot client, you are provided with a large number of free services for efficient trading.


