


The legend in the InstaSpot team!
Legend! You think that's bombastic rhetoric? But how should we call a man, who became the first Asian to win the junior world chess championship at 18 and who became the first Indian Grandmaster at 19? That was the start of a hard path to the World Champion title for Viswanathan Anand, the man who became a part of history of chess forever. Now one more legend in the InstaSpot team!


Borussia is one of the most titled football clubs in Germany, which has repeatedly proved to fans: the spirit of competition and leadership will certainly lead to success. Trade in the same way that sports professionals play the game: confidently and actively. Keep a "pass" from Borussia FC and be in the lead with InstaSpot!

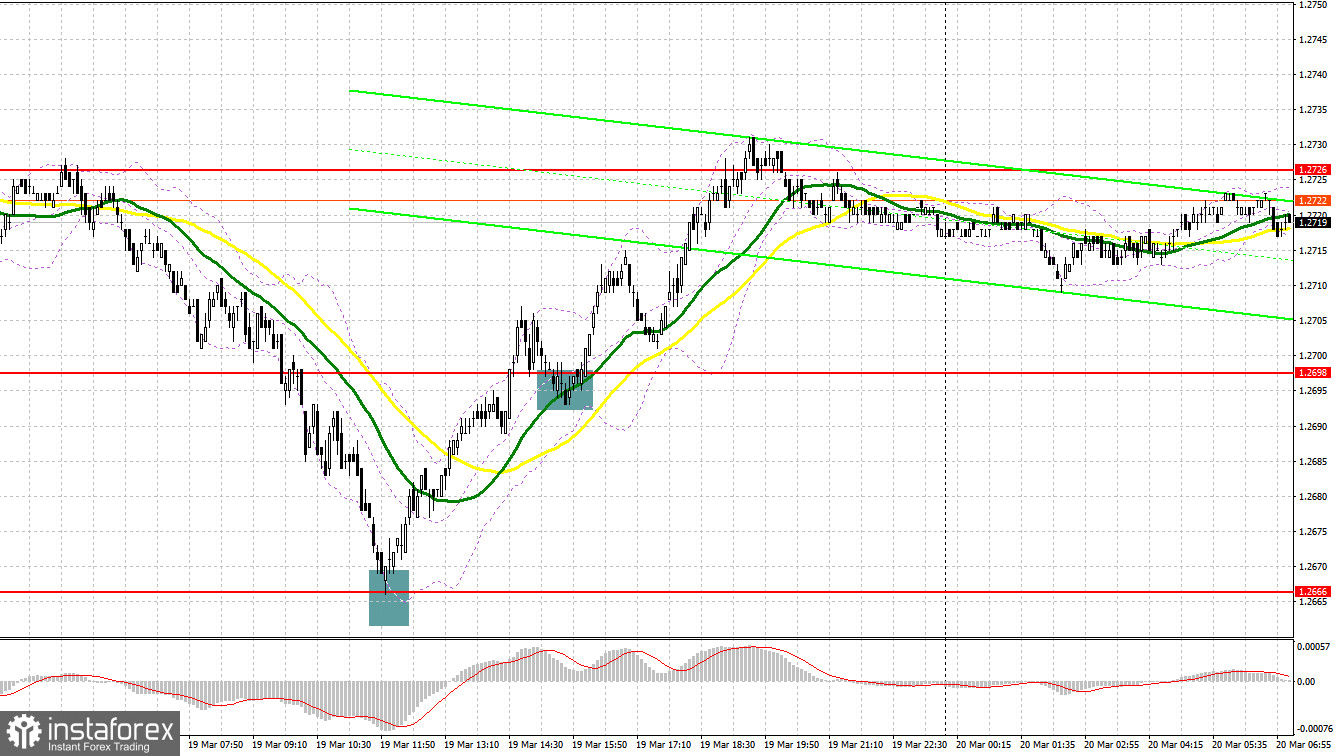
Yesterday, traders received some great signals to enter the market. Let's have a look at what happened on the 5-minute chart. In my morning review, I mentioned the level of 1.2666 as a possible entry point. A decline and false breakout there produced a buy signal, which sent the pair up by almost 30 pips. In the second half of the day, a breakout and retest of 1.2698 generated another buy signal. As a result, the pair was up by more than 30 pips.
What is needed to open long positions on GBP/USD
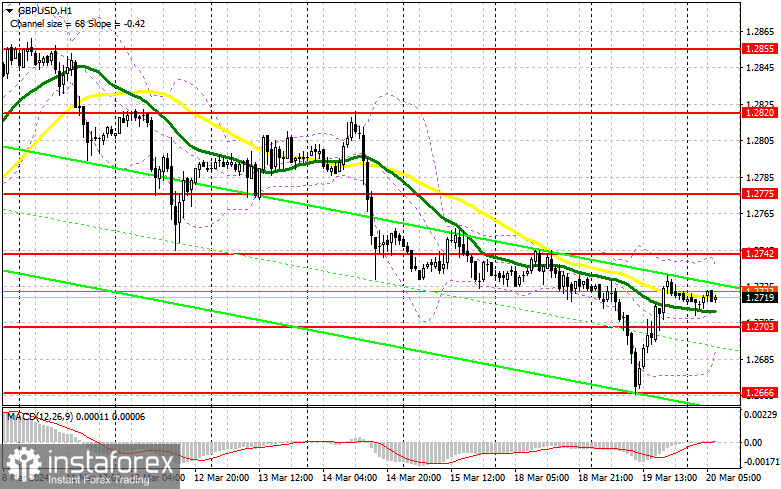
The dollar weakened yesterday despite good real estate market data in the US. However, today everything could change, as traders look to the release of the UK inflation data. Figures for the UK Consumer Price Index, core prices, as well as Purchasing Managers' Indices for both manufacturing and retail prices, are expected. A decrease in inflation will negatively impact the pound, leading to a rapid decline in the pair. Therefore, we should be cautious for this reason. In case the pair falls, I would prefer to act after a false breakdown close to the nearest support at 1.2703. This will give a good entry point for long positions in hopes that demand will return with the prospect of testing 1.2742 - a new resistance established yesterday. A breakout and consolidation above this range will strengthen the bulls' positions and open the way to 1.2775. The farthest target is seen at the high of 1.2820, where I am going to take profit. In case of a decline and a lack of bullish activity at 1.2703, the pound may continue to fall, which will lead to forming a downtrend. In this case, only a false breakdown near the next support at 1.2666 will confirm the correct entry point. I plan to buy GBP/USD just after a rebound from the low of 1.2636, aiming for a correction of 30-35 pips within the day.
What is needed to open short positions on GBP/USD
The bears lost control of the market yesterday and they could face new challenges today, provided that UK inflation shows a larger than expected rise in February - especially core prices. For this reason, the sellers' goal is to protect the resistance at 1.2742. Missing it could affect the entire trend. A false breakout near 1.2742 will confirm the sell signal, which will lead to selling and a decline to the 1.2703 area. A breakout and an upward test of this range will deal a blow to the bulls' positions, leading to the removal of stop orders and open the way to 1.2666. This is where I expect big buyers to show up. The farthest target will be the area of 1.2636, where they will take profits. If GBP/USD grows and there is no activity at 1.2742, buyers will feel the strength again in the expectation of a bullish correction. In this case, I will postpone selling until there is a false breakdown at 1.2775. If there is no downward movement there, I will sell GBP/USD just after a bounce from 1.2820, in anticipation of the pair declining by 30-35 pips intraday.
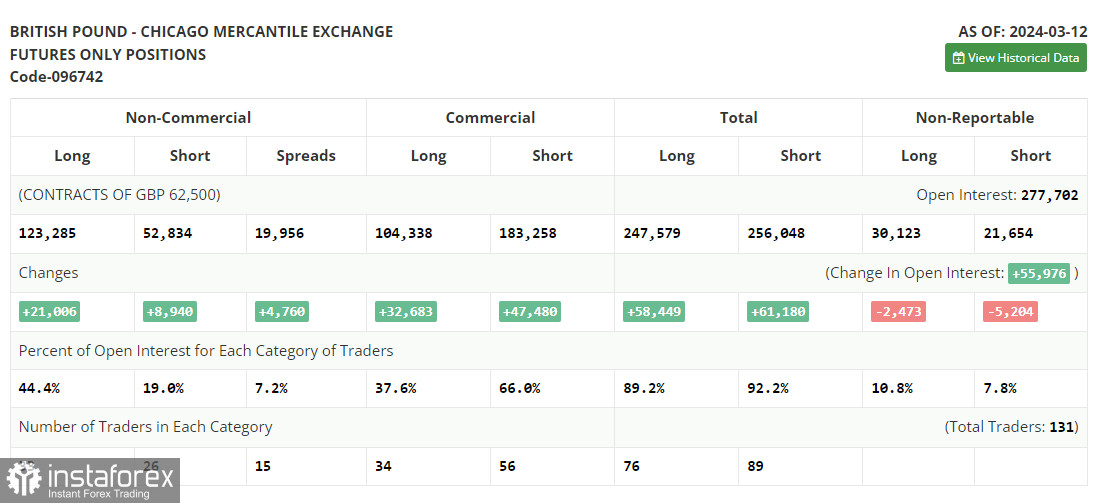
COT report:
According to the COT report (Commitment of Traders) for March 12, the number of both short and long positions increased. The British pound is still in demand despite expectations that interest rates in the UK may be lowered even if inflation does not reach the 2% target. The current corrective phase is entirely due to sharp demand for the US dollar across the market, which is associated with the release of the latest US inflation data. The third consecutive month of price increases will surely compel the Federal Reserve to adhere to a tight policy for as long as possible, which is currently reflected in the market. The latest COT report unveiled that long non-commercial positions rose by 21,006 to 123,285, while short non-commercial positions jumped by 8,940 to 52,834. As a result, the spread between long and short positions increased by 4,760.
Indicators' signals
Moving averages
Trading just around the 30- and 50-day moving averages indicates sideways movement.
Note: The period and prices of the moving averages are considered by the analyst on the 1-hour chart and differ from the general definition of classic daily moving averages on the daily chart.
Bollinger Bands
In case GBP/USD goes down, the indicator's lower border near 1.2700 will act as support.
Description of indicators
*The market analysis posted here is meant to increase your awareness, but not to give instructions to make a trade.
InstaSpot analytical reviews will make you fully aware of market trends! Being an InstaSpot client, you are provided with a large number of free services for efficient trading.


