


EUR/USD
Analysis:
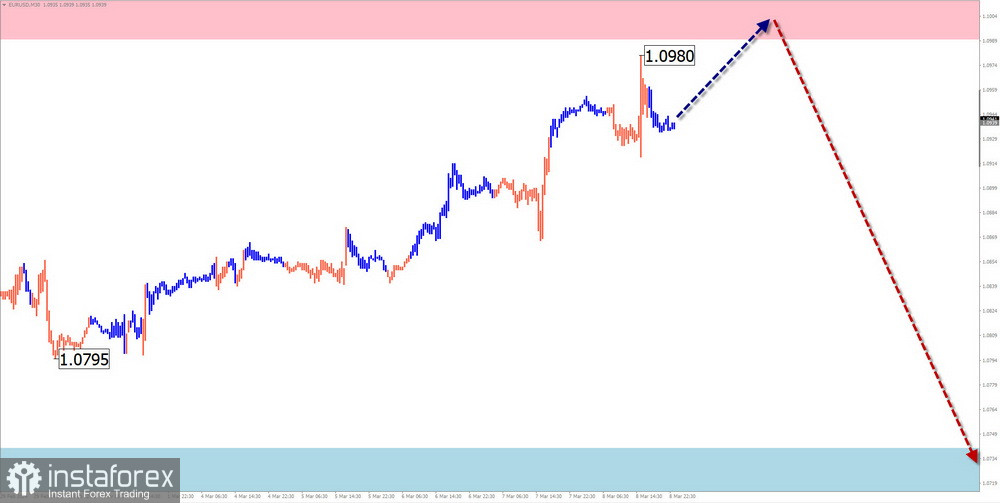
On the chart of the euro from July of last year, a descending wave zigzag is forming. The analysis of the wave structure indicates the formation of a correction in the final part (C), forming a shifting plane on the chart. Its structure is nearing completion, and the price is at the lower boundary of a powerful potential reversal zone.
Forecast:
During the upcoming week, the price is expected to move within a sideways corridor between the nearest support and resistance zones. An upward vector is more probable in the first few days. Towards the weekend, the probability of a reversal and a decline in quotes increases, possibly reaching the support boundaries.
Potential Reversal Zones
Resistance:
Support:
Recommendations:
Buying: Fractional volumes are possible during specific trading sessions.
Selling: Conditions for such transactions are not present until signals of a reversal appear around the resistance zone.
USD/JPY
Analysis:
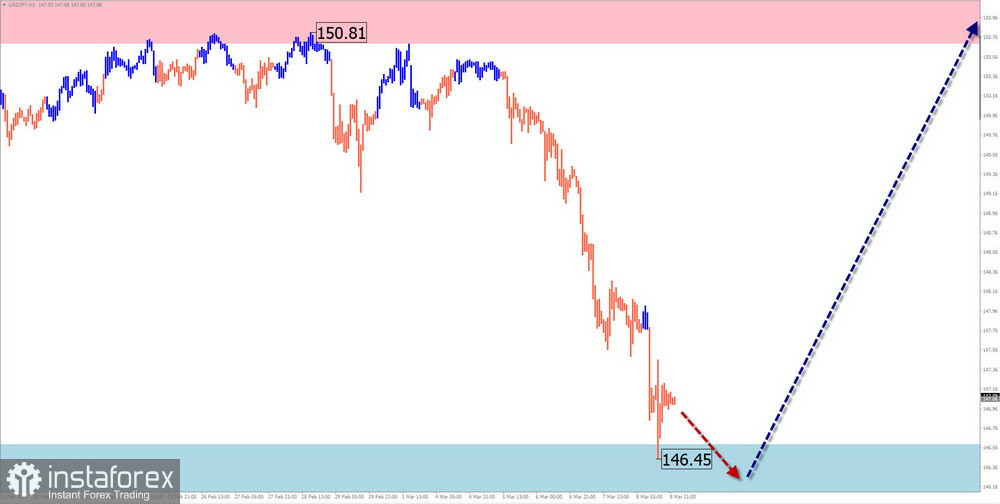
Since July of last year, the chart of the main pair with the Japanese yen has been weakening against the US dollar. In the structure of this bullish wave at the end of the year, the final wave (C) is forming. Within it, the corrective part (B) is nearing completion, forming a shifting plane on the chart. The price has reached the lower boundary of a powerful weekly resistance zone.
Forecast:
During the upcoming week, an overall flat price movement is expected for the pair. After pressure on the support zone, one can expect a reversal and a resumption of the price rise, with an increase towards the resistance zone.
Potential Reversal Zones
Resistance:
Support:
Recommendations:
Selling: Carry a high level of risk. Calculated support limits the potential for a decrease.
Buying: This will be possible after the appearance of confirmed reversal signals around the support zone.
GBP/JPY
Analysis:
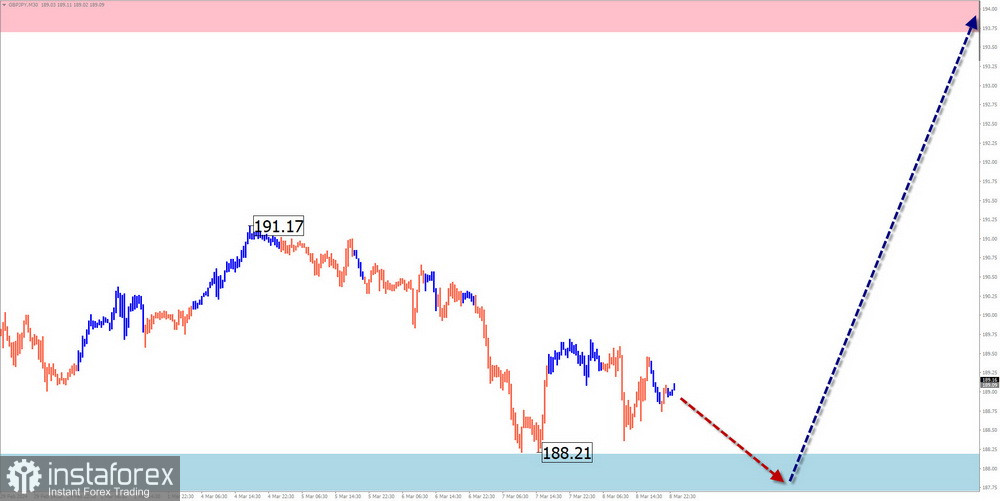
A global bullish trend dominates the chart of the cross rate of the British pound and the Japanese yen. Since July of last year, an unfinished upward wave zigzag has been developing. The price fluctuations of the last two months form an intermediate correction (B) within a sideways plane. After its completion, the pair's price is expected to continue rising.
Forecast:
At the beginning of the upcoming week, one can expect the quotes of the cross rate to move along the support zone, possibly putting pressure on its lower boundary. After that, a change in direction and a resumption of the price rise are expected amid increased volatility. A breakthrough above the calculated resistance boundaries within the week is unlikely.
Potential Reversal Zones
Resistance:
Support:
Recommendations:
Buying: Conditions for such transactions are not present until confirmed reversal signals appear in the support zone.
Selling: Fractional volumes may be used during specific trading sessions.
USD/CAD
Analysis:
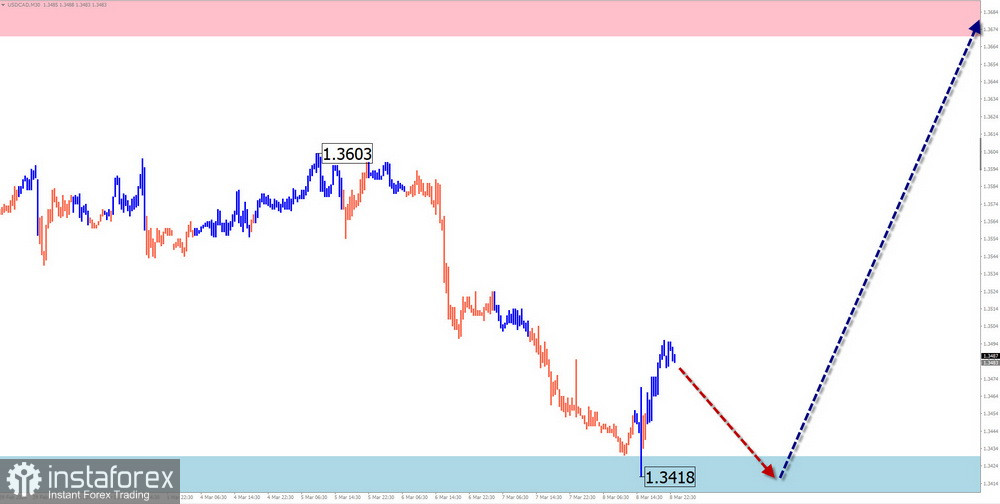
The short-term trend direction on the chart of the main Canadian dollar pair sets an upward trend. In the structure of the wave, the average corrective part (B) is nearing completion. The pair's price is at the lower boundary of a powerful potential reversal zone on the large-scale chart. There are no ready signals for an imminent change in course on the chart.
Forecast:
In the coming days, one can expect the price to move along the support zone. Within its boundaries, a halt is probable, creating conditions for a reversal. It is not excluded that the breakdown of the lower boundary of the calculated support may accompany a change in direction. The resumption of the price rise can be expected closer to the weekend.
Potential Reversal Zones
Resistance:
Support:
Recommendations:
Selling: Due to the low potential of the expected move, it may lead to deposit losses.
Buying: This will be possible after the appearance of confirmed signals of a change in direction in the support zone.
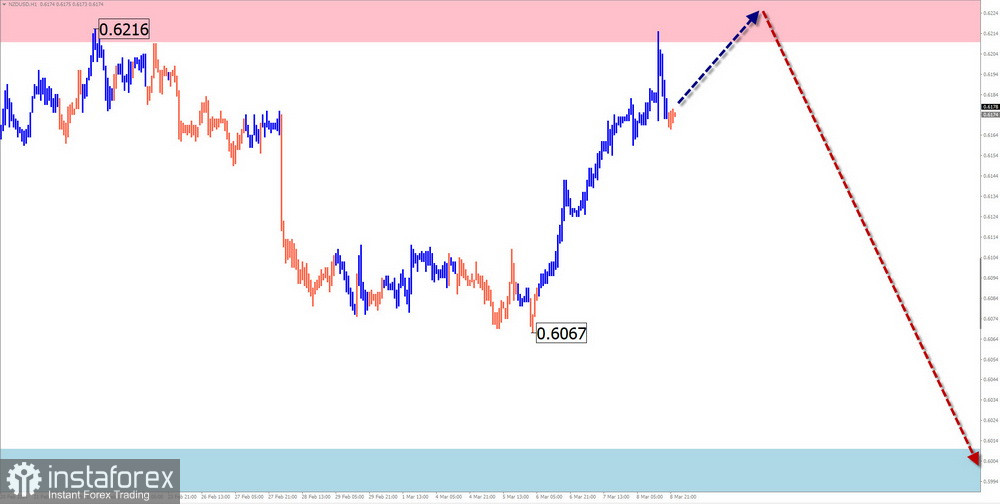
NZD/USD
Analysis:
Since July of last year, the quotes of the main New Zealand dollar pair have been forming a descending wave. The final part (C) is developing within the structure. The last two months have been a period of correction, nearing completion. The price is at the upper boundary of a powerful potential reversal zone. There are no ready signals of a reversal.
Forecast:
In the upcoming week, the completion of the current rise is expected, leading to a reversal and creating conditions for the resumption of the price decline. A brief breakthrough above the upper boundary of the calculated resistance is possible during the change in course.
Potential Reversal Zones
Resistance:
Support:
Recommendations:
Selling: Fractional volumes are possible during intraday trading.
Buying: Conditions for such transactions are not present until confirmed signals appear in the support zone.
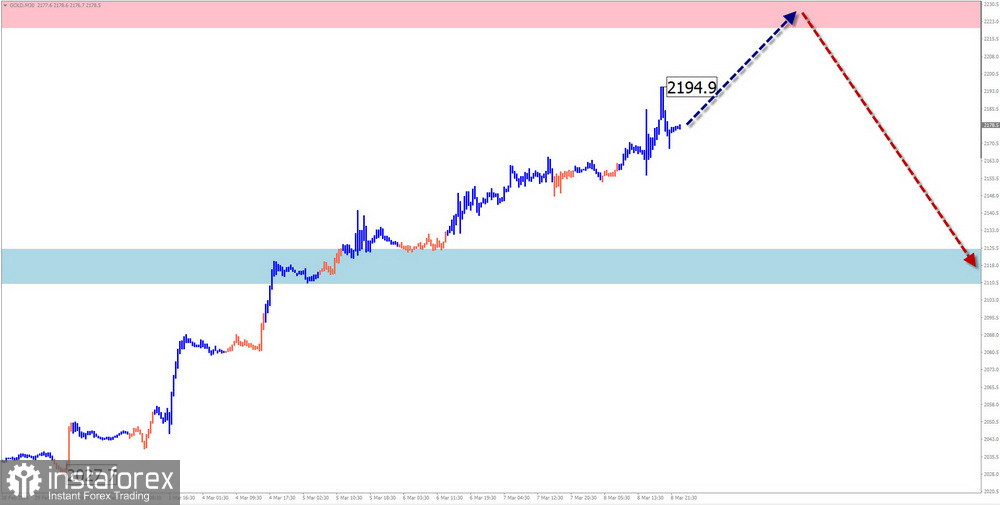
Gold
Analysis:
The direction of gold price fluctuations on the index chart from March of last year forms a descending wave algorithm. The extremes of the wave on the chart form a "stretched plane" figure. Since the end of September, the average part of the wave has been developing and is not yet complete. Quotes are moving in the area of a powerful potential reversal zone on the weekly scale chart.
Forecast:
At the beginning of the upcoming week, one can expect a continuation of the upward vector. In the area of the calculated resistance, the probability of a sudden stop and a transition to sideways drift sharply increases. Closer to the weekend, a change in direction and a decrease in quotes towards the calculated support are expected.
Potential Reversal Zones
Resistance:
Support:
Recommendations:
Buying: Reduced lots can be used during specific sessions until the first reversal signals appear.
Selling: This will be possible after confirmed reversal signals appear in the resistance zone using your trading systems.
Notes: In simplified wave analysis (SWA), all waves consist of 3 parts (A-B-C). The analysis focuses on the last, unfinished wave in each time frame. Dashed lines indicate expected movements.
Attention: The wave algorithm does not consider the duration of instrument movements over time!
*The market analysis posted here is meant to increase your awareness, but not to give instructions to make a trade.
InstaSpot analytical reviews will make you fully aware of market trends! Being an InstaSpot client, you are provided with a large number of free services for efficient trading.


