


Our team has over 7,000,000 traders!
Every day we work together to improve trading. We get high results and move forward.
Recognition by millions of traders all over the world is the best appreciation of our work! You made your choice and we will do everything it takes to meet your expectations!
We are a great team together!
InstaSpot. Proud to work for you!


Actor, UFC 6 tournament champion and a true hero!
The man who made himself. The man that goes our way.
The secret behind Taktarov's success is constant movement towards the goal.
Reveal all the sides of your talent!
Discover, try, fail - but never stop!
InstaSpot. Your success story starts here!

Once again, the single currency tried to climb above the 1.0850 level, which serves as the upper boundary of the range from which it has been unable to break free of for two consecutive weeks. However, similar to the previous day, the attempt proved to be unsuccessful. In general, the market continued to stay near the upper boundary of the range. Although the final estimates of the Eurozone's PMI readings turned out better than the preliminary estimates, which already indicated growth. However, the situation in the United States is even better. For instance, the Composite PMI, which, according to preliminary estimates, decreased, eventually showed an increase. Therefore, the PMI reports offset each other. The market ignored the Eurozone Producer Price Index. Although the pace of its decline slowed down, it wasn't as significant as expected. This suggests that the market needs more substantial reasons to break out of the stagnant phase.
This could happen today. The Eurozone retail sales report could provide fresh impetus, as the data is foreseen at -0.3%, easing slightly from the previous -0.8%. In addition, market players expect negative forecasts for the U.S. labor market. Employment is seen to grow by only 90,000, which is incredibly low, considering the previous month's growth of 107,000, which was also already quite low to begin with. An extremely unpleasant picture is starting to form, indicating a rapid deterioration of the labor market. On Friday, the United States Department of Labor will release a key report that could greatly disappoint investors. All of this creates conditions for the market to break out of the stagnant phase, potentially strengthening the euro.
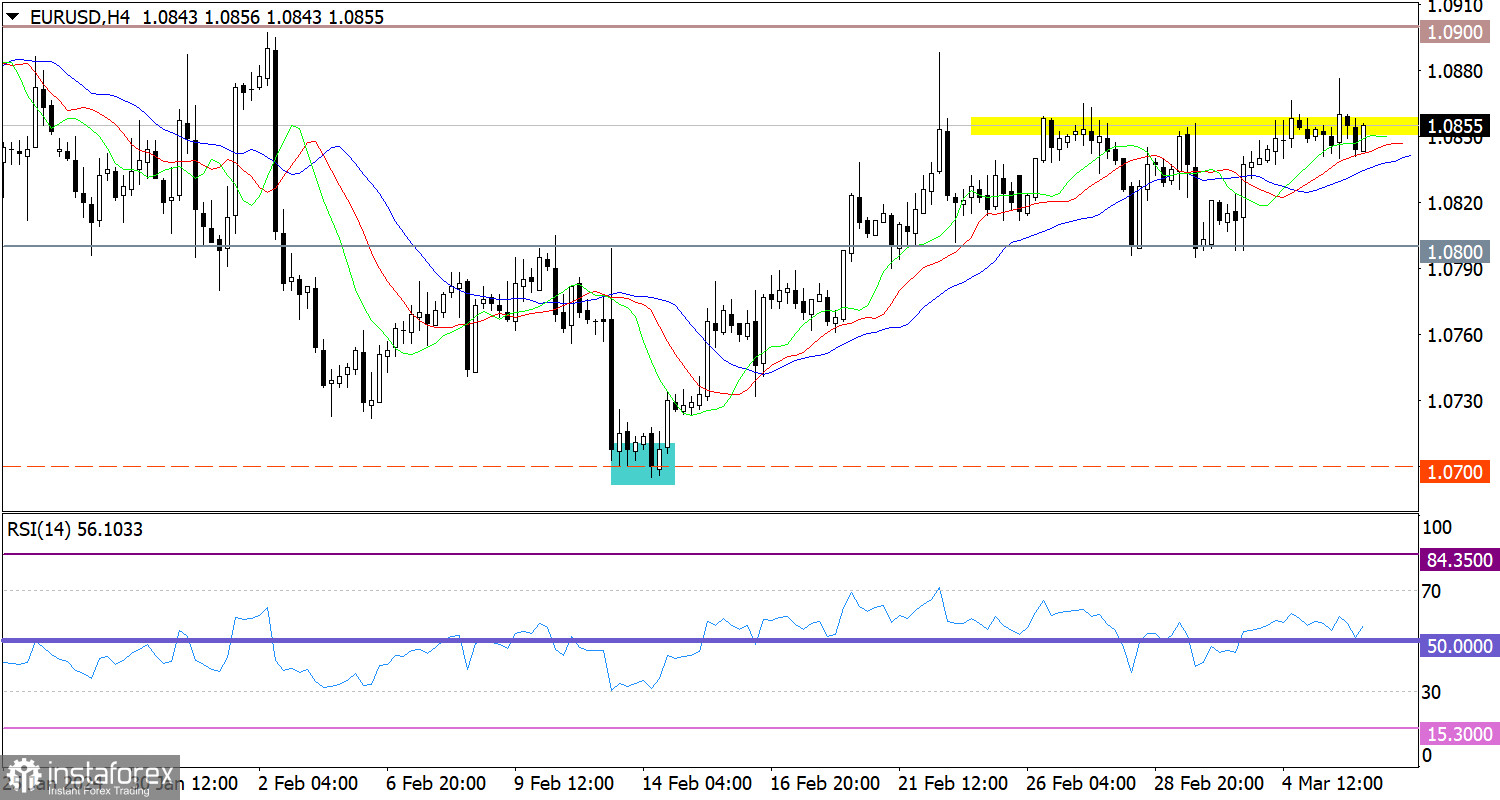
EUR/USD is on the verge of leaving the sideways range between 1.0800 and 1.0850. However, based on yesterday's trading activity, there is an accumulation of positions, expressed in the form of a doji candle.
On the four-hour chart, the RSI technical indicator is hovering in the upper area of 50/70. Currently, the indicator's movement is comparable to the price fluctuations within the flat range.
On the same chart, the Alligator's MAs are headed upwards, indicating a bullish bias.
In case EUR/USD grows further above the level of 1.0850, this could be a sign that the pair is finally leaving the sideways range and the volume of long positions could strengthen towards 1.0900. The bearish scenario will come into play if the price fails to settle above the boundary of the flat range. In this case, the price could go back to the 50-60 pip range.
In terms of complex indicator analysis, an upward movement is likely in the short term and intraday periods, which is in line with the price approaching the upper boundary of the flat range.
*The market analysis posted here is meant to increase your awareness, but not to give instructions to make a trade.
InstaSpot analytical reviews will make you fully aware of market trends! Being an InstaSpot client, you are provided with a large number of free services for efficient trading.


