


Our team has over 7,000,000 traders!
Every day we work together to improve trading. We get high results and move forward.
Recognition by millions of traders all over the world is the best appreciation of our work! You made your choice and we will do everything it takes to meet your expectations!
We are a great team together!
InstaSpot. Proud to work for you!


Actor, UFC 6 tournament champion and a true hero!
The man who made himself. The man that goes our way.
The secret behind Taktarov's success is constant movement towards the goal.
Reveal all the sides of your talent!
Discover, try, fail - but never stop!
InstaSpot. Your success story starts here!

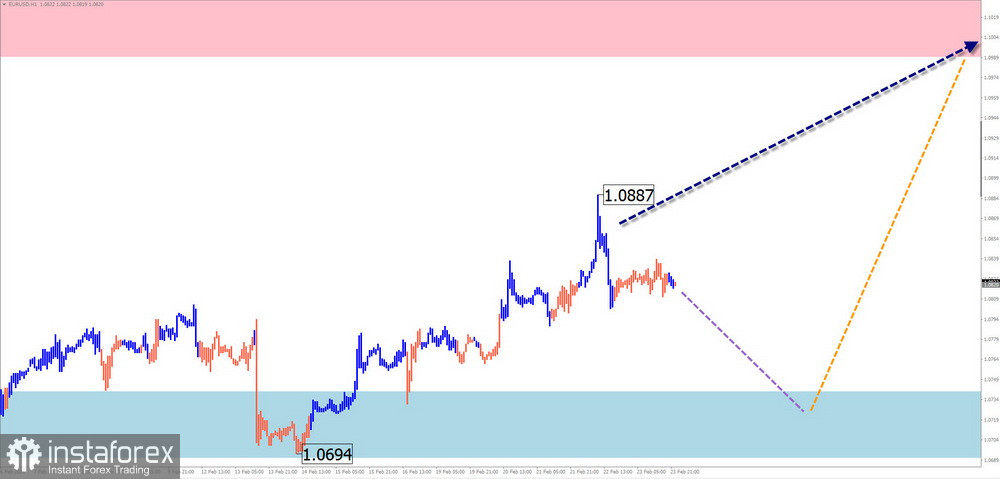
EUR/USD
Analysis:
On the chart of the main euro currency pair, the formation of a descending shifting plane has continued since July of last year. This segment corrects the previous upward trend, forming extremes on the chart in the shape of a "horizontal pennant." Quotes drift within a price channel within the powerful potential reversal zone of the weekly chart.
Forecast:
In the first half of the upcoming week, a weak upward vector can be expected, with the price rising to the lower resistance boundary. Subsequently, a reversal and decline can be anticipated, with the price moving down to the support zone.
Potential Reversal Zones
Resistance:
Support:
Recommendations:
Buying: Possible with reduced volume during individual trading sessions.
Selling: This can be used from the resistance zone after the appearance of corresponding reversal signals.
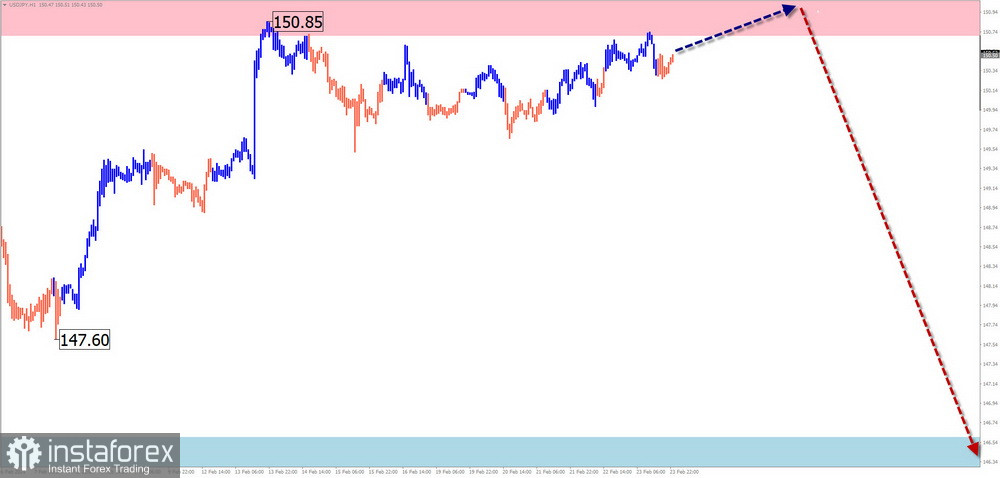
USD/JPY
Analysis:
On the chart of the main Japanese yen pair, an ascending wave zigzag has been forming since the end of December of the previous year. Since December, quotes have formed a correction in the form of a shifting plane. This wave model was not completed at the time of analysis. The price is approaching the lower boundary of a powerful resistance zone on the weekly chart.
Forecast:
Throughout the upcoming week, the continuation of the current flat movement is expected, with the price moving along the boundaries of the resistance zone. By the end of the week, the probability of a reversal formation and the beginning of a downward trend increases. Upon a change in course, pressure and a short-term breakthrough of the upper limit of the zone are possible.
Potential Reversal Zones
Resistance:
Support:
Recommendations:
Buying: Have no potential and may lead to losses.
Selling: This will become relevant only after the appearance of confirmed reversal signals around the resistance zone.
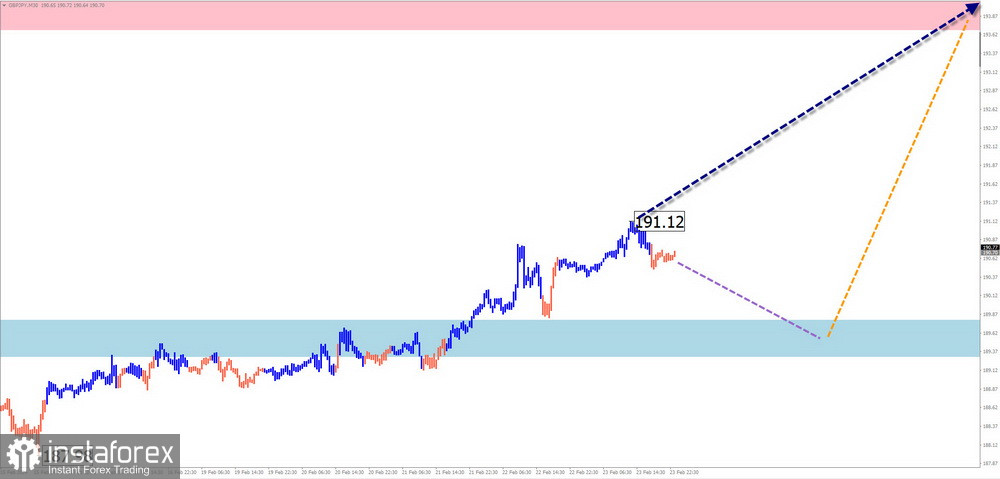
GBP/JPY
Analysis:
The price movement direction of the pound/yen pair forms an unfinished ascending wave segment, with a starting point from December 7 of the previous year. In the last month and a half, the price has been forming a complex correction in the form of a shifting plane, which has not yet been completed. The pair's price drifts along the upper boundary of a powerful potential reversal zone on the daily timeframe.
Forecast:
At the beginning of the upcoming week, a sideways movement is more likely. A reversal formation can be expected around the calculated support. The resumption of the price rise is more likely towards the end of the week.
Potential Reversal Zones
Resistance:
Support:
Recommendations:
Selling: This has low potential and can be risky for the deposit.
Buying: This will become relevant for trading after the appearance of corresponding signals around the support zone.
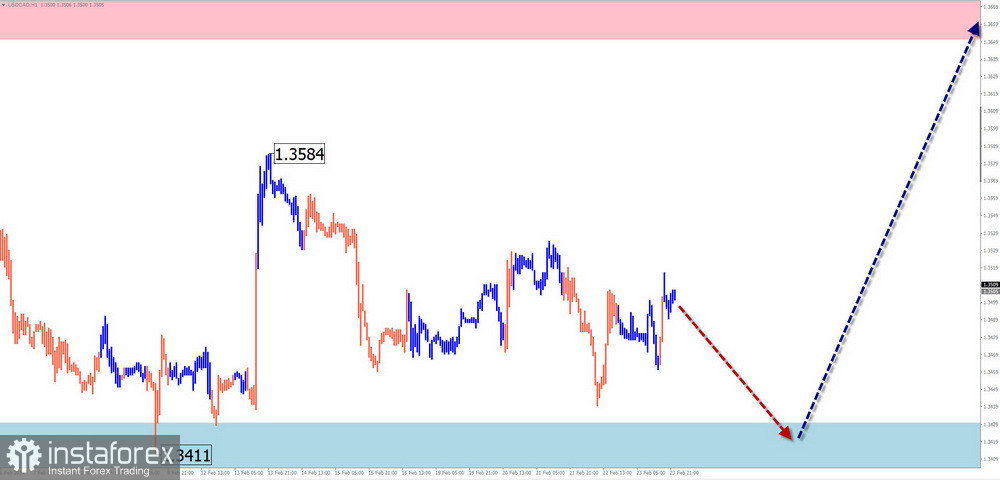
USD/CAD
Analysis:
Since the end of last year, the quotes of the main Canadian dollar pair have been forming an ascending wave. The unfinished corrective segment from February 13 forms an elongated plane. The calculated resistance passes along the lower boundary of a powerful potential reversal zone on the weekly chart.
Forecast:
Throughout the upcoming week, the completion of the ascending movement is expected, creating conditions for a reversal and the beginning of a decline in the exchange rate. In the next couple of days, a sideways movement is the most likely scenario.
Potential Reversal Zones
Resistance:
Support:
Recommendations:
Selling: Similar transactions may be unprofitable until clear reversal signals appear.
Buying: This can be used in trading with an intraday fractional lot up to the resistance zone.
NZD/USD
Analysis:
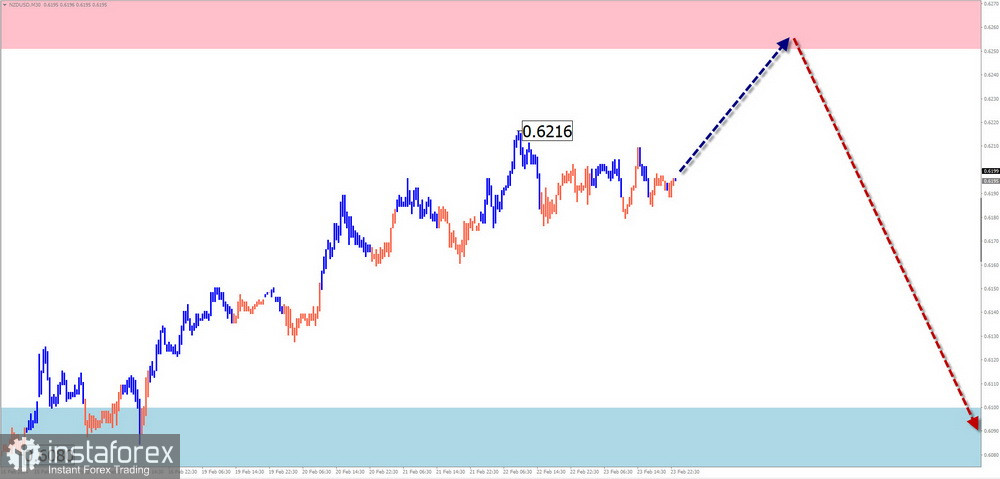
On the chart of the main New Zealand dollar pair, a descending trend wave has been forming since July of last year. The structure of the wave from the end of December forms the beginning of the final part (C). Within it, an offset rollback has been forming in the form of an elongated plane in recent weeks. Its structure is close to completion. Last week, the price broke a strong support, turning it into resistance.
Forecast:
In the coming days, a continuation of the downward movement of the pair can be expected, with a decrease in price to the support zone. At the beginning of the week, short-term pressure on the resistance zone cannot be ruled out. Higher volatility is expected towards the end of the week. There is a high probability of synchronizing the reversal with the release of important economic data.
Potential Reversal Zones
Resistance:
Support:
Recommendations:
Buying: High-risk and may be unprofitable until the current decline is completed.
Selling: Capable of being profitable in trading. Signals in the resistance zone are necessary for entry.
Gold
Analysis:
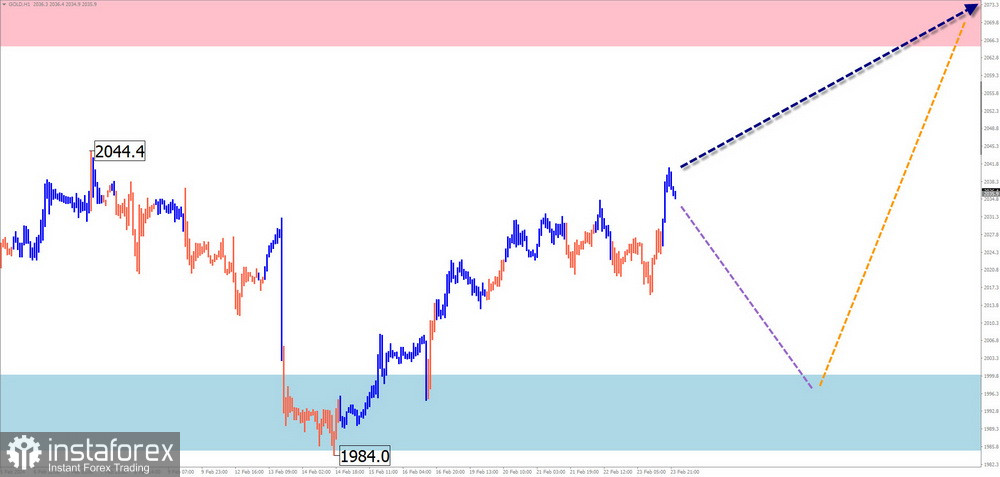
The price of gold is at historical highs. The short-term trend direction of gold is set by the algorithm of the descending wave from December 4 of last year. The unfinished segment of this wave forms an ascending correction. The wave is close to completion.
Forecast:
In the coming days, a price increase and an attempt to exert pressure on the upper boundary of the resistance zone can be expected. Afterward, the probability of a sharp reversal and resumption of a price decrease increases. A powerful potential reversal zone of the weekly chart instrument passes near the calculated support.
Potential Reversal Zones
Resistance:
Support:
Recommendations:
Buying: Have low potential and may lead to deposit losses.
Selling: Can be used only after confirmed reversal signals appear in the resistance zone.
Explanation: In Simplified Wave Analysis (SWA), all waves consist of 3 parts (A-B-C). The latest unfinished wave is analyzed for each timeframe. Dashed lines indicate expected movements.
Attention: The wave algorithm does not take into account the duration of instrument movements over time!
*The market analysis posted here is meant to increase your awareness, but not to give instructions to make a trade.
InstaSpot analytical reviews will make you fully aware of market trends! Being an InstaSpot client, you are provided with a large number of free services for efficient trading.


