


Our team has over 7,000,000 traders!
Every day we work together to improve trading. We get high results and move forward.
Recognition by millions of traders all over the world is the best appreciation of our work! You made your choice and we will do everything it takes to meet your expectations!
We are a great team together!
InstaSpot. Proud to work for you!


Actor, UFC 6 tournament champion and a true hero!
The man who made himself. The man that goes our way.
The secret behind Taktarov's success is constant movement towards the goal.
Reveal all the sides of your talent!
Discover, try, fail - but never stop!
InstaSpot. Your success story starts here!

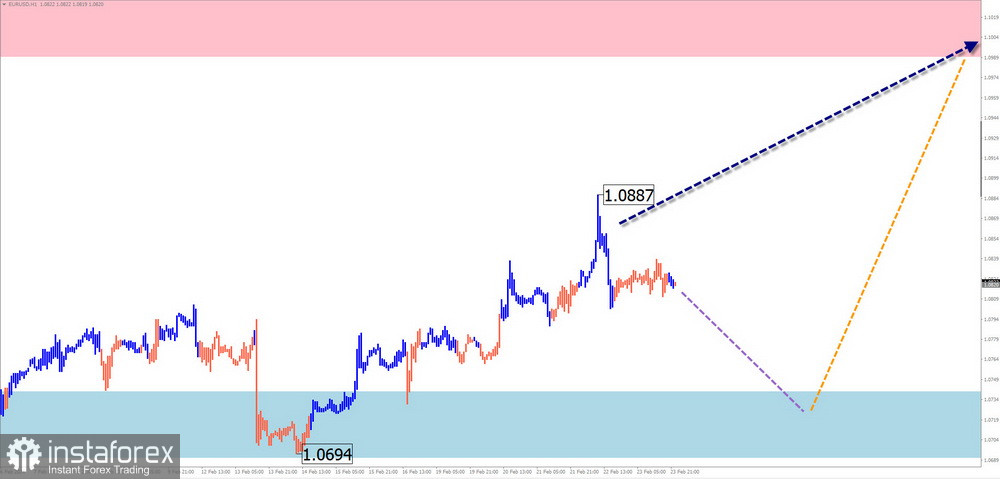
EUR/USD
Analysis:
An unfinished bearish wave structure on the euro currency chart has been counting since mid-July last year. Its wave level has exceeded the scale of the daily timeframe. The final part (C) has been forming in the wave structure since the end of December. A corrective rally started within it two waves ago.
Forecast:
A gradual movement of the price towards the calculated resistance area is expected in the upcoming week. A temporary decrease in the support zone is probable in the first few days. Afterward, the anticipation is for a reversal formation and a resumption of the price ascent. Increased volatility is possible upon a change of direction.
Potential Reversal Zones
Resistance:
Support:
Recommendations:
Selling: Such deals are risky due to their limited potential.
Buying: Trading in this direction may become profitable after the appearance of reversal signals in the calculated support area confirmed by your trading system.
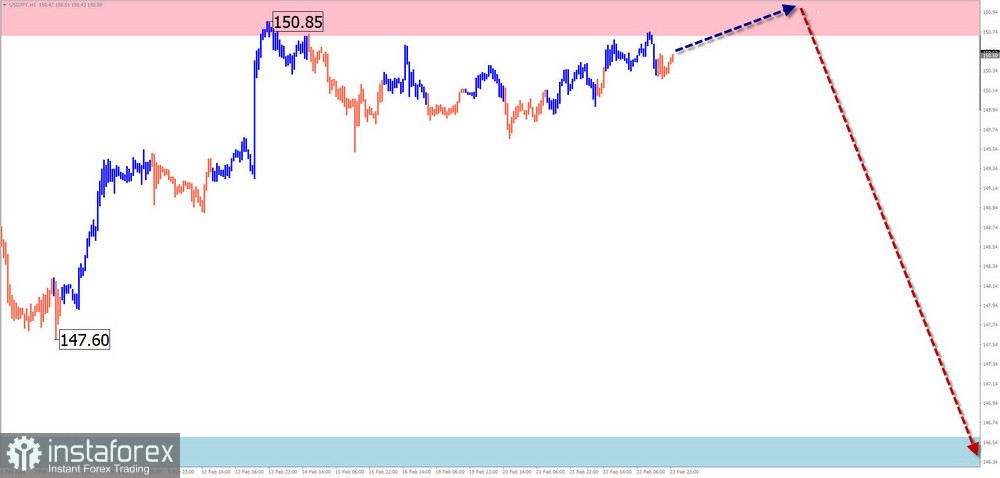
USD/JPY
Analysis:
The analysis of the wave situation in the Japanese yen market highlights the segment with an unfinished ascending wave from December 28th of the previous year. The wave is in the final phase of its movement. Quotes have reached the lower boundary of a powerful weekly resistance zone. No signals of an imminent reversal are observed on the chart.
Forecast:
At the beginning of this week, conditions for a reversal are expected in the resistance zone. Upon a change of direction, a brief break above the upper boundary of this zone cannot be ruled out. Subsequently, a decline will follow. The calculated support indicates the lower boundary of the expected weekly move.
Potential Reversal Zones
Resistance:
Support:
Recommendations:
Buying: There are no conditions for such transactions.
Selling: Prospective sales may occur after corresponding signals appear in the calculated resistance area.
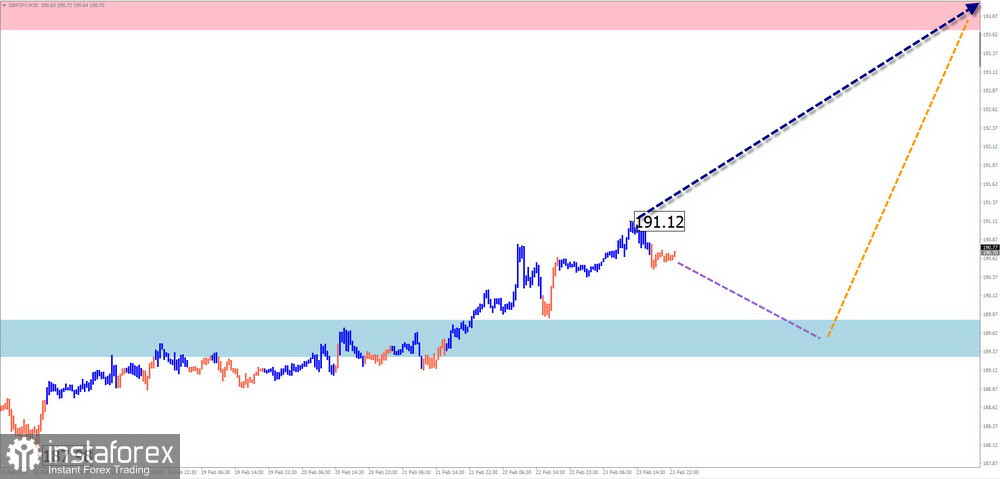
GBP/JPY
Analysis:
The main direction of the price movement of the British pound/Japanese yen pair since December of the previous year is defined by an ascending wave algorithm. After a corrective phase, the pair's quotes broke through the upper boundary of a powerful potential reversal zone, turning it into support. Before continuing the ascent, the price needs to consolidate above the achieved milestone.
Forecast:
At the beginning of the upcoming week, a flat movement along the boundaries of the calculated support is expected, creating conditions for a reversal of the movement. The resumption of the price rise is more likely in the second half of the week. A sharp increase in volatility is not excluded upon a change in course.
Potential Reversal Zones
Resistance:
Support:
Recommendations:
Selling: Similar transactions in the cross-market may lead to a loss of the deposit.
Buying: Deals in this direction will become relevant after confirming signals in the calculated resistance area.
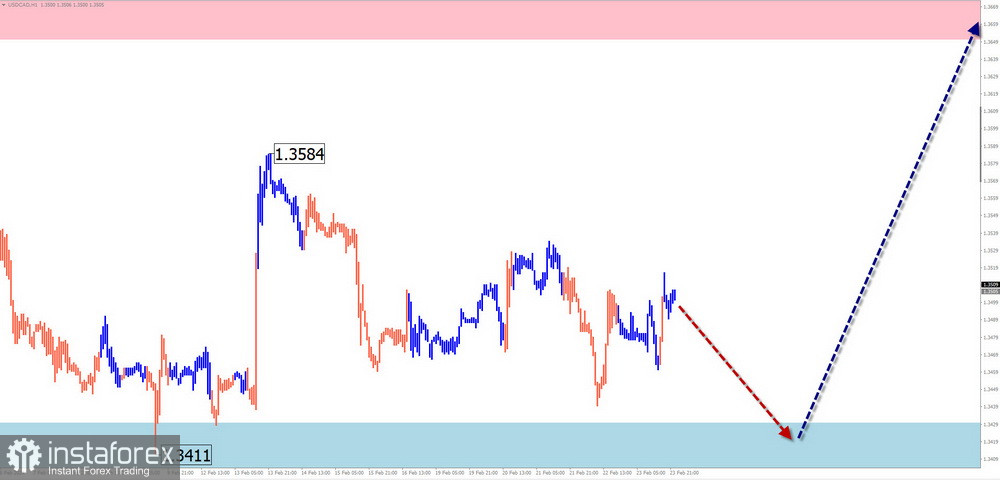
USD/CAD
Analysis:
An ascending wave has been developing on the chart of the main Canadian currency pair since the end of December. In its structure, a descending correction has been forming since last month in the form of a shifting plane. At the time of analysis, quotes are close to the lower boundary of the price corridor. No signals of an immediate reversal are observed on the chart.
Forecast:
In the first half of the upcoming week, sideways tuning of price fluctuations can be expected. Pressure on the support zone is possible. Closer to the weekend, after the conditions for a change of direction are formed, an increase in the exchange rate can be anticipated up to resistance levels.
Potential Reversal Zones
Resistance:
Support:
Recommendations:
Selling: Due to the limited potential, transactions in this direction are high-risk.
Buying: After confirming signals on your used trading system, buying may become the main direction for trading.
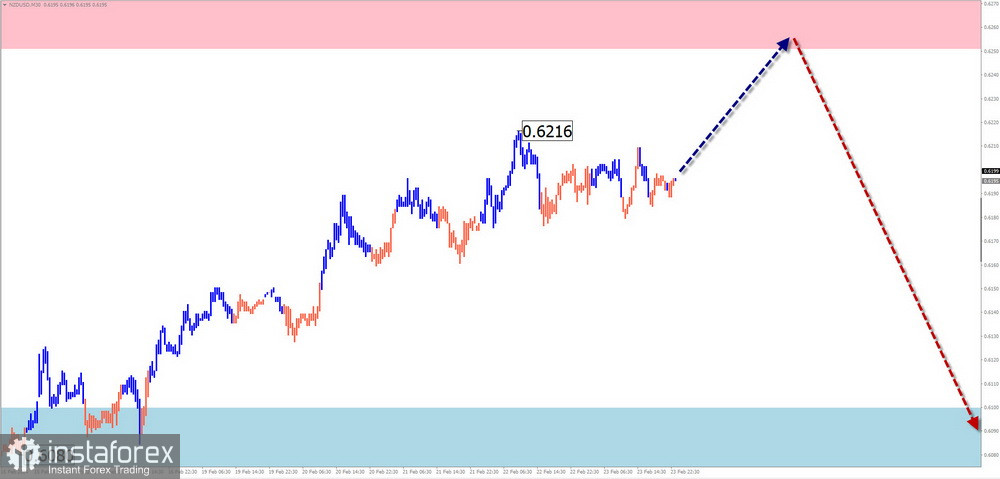
NZD/USD
Analysis:
The price movement direction of the major New Zealand Dollar pair since the end of the previous year is determined by a descending wave algorithm. In its structure, the price forms a correction in the form of a horizontal stretched plane for the entire month. This movement is in its final phase.
Forecast:
The ascending trend of the price movement is expected in the upcoming week, up to its complete completion in the calculated resistance area. Closer to the weekend, a reversal formation and the creation of conditions for the start of the downward movement of the price can be expected.
Potential Reversal Zones
Resistance:
Support:
Recommendations:
Buying: Fractional volumes within individual trading sessions are possible. The resistance zone limits the potential.
Selling: Preemptive sales before reversal signals in the resistance area are premature.
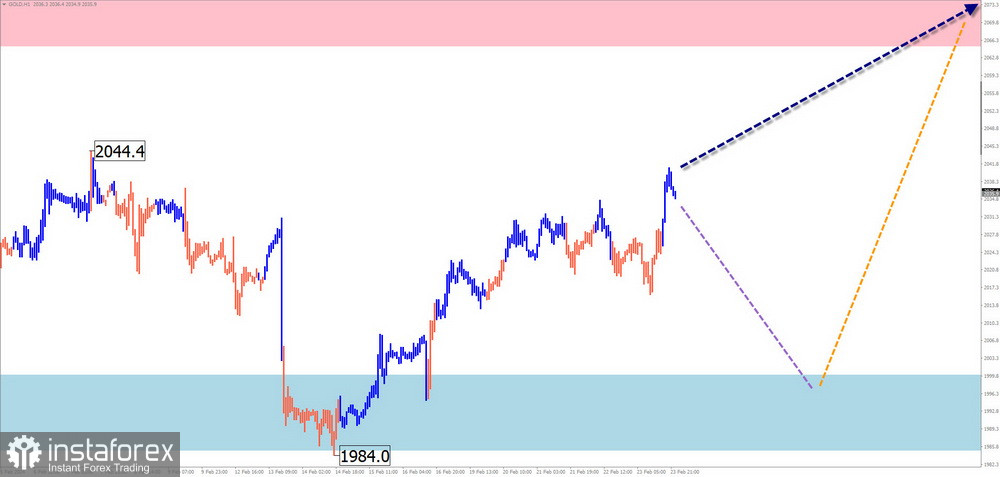
Gold
Analysis:
Gold quotes continue to form a descending wave that started in December of the previous year. The wave level of the descending segment does not go beyond the correction of the previous bullish wave. The price is approaching the upper edge of the potential reversal zone of the weekly chart.
Forecast:
In the next couple of days, a continuation of the overall sideways trend in gold price fluctuations can be expected. A decrease in the support zone is likely in the first few days. Further, in this zone, conditions for a reversal are expected, with subsequent price growth. A breakthrough beyond the calculated boundaries of opposing zones during the upcoming week is unlikely.
Potential Reversal Zones
Resistance:
Support:
Recommendations:
Selling: They have a low potential, which may lead to losses.
Buying: After confirmed signals of a course change, buying may become the main direction for trading on this instrument.
Explanations: In simplified wave analysis (SWA), all waves consist of 3 parts (A-B-C). Only the last unfinished wave is analyzed in each timeframe. Dashed lines indicate expected movements.
Note: Wave algorithm does not consider the duration of instrument movements in time!
*The market analysis posted here is meant to increase your awareness, but not to give instructions to make a trade.
InstaSpot analytical reviews will make you fully aware of market trends! Being an InstaSpot client, you are provided with a large number of free services for efficient trading.


