


The legend in the InstaSpot team!
Legend! You think that's bombastic rhetoric? But how should we call a man, who became the first Asian to win the junior world chess championship at 18 and who became the first Indian Grandmaster at 19? That was the start of a hard path to the World Champion title for Viswanathan Anand, the man who became a part of history of chess forever. Now one more legend in the InstaSpot team!


Borussia is one of the most titled football clubs in Germany, which has repeatedly proved to fans: the spirit of competition and leadership will certainly lead to success. Trade in the same way that sports professionals play the game: confidently and actively. Keep a "pass" from Borussia FC and be in the lead with InstaSpot!

Data on retail sales in the UK was published last Friday. Retail sales increased by 0.7%, whereas the consensus suggested that the decline would have only slowed down from -2.4% to -1.4%.
During the American trading session, data on factory inflation in the US was published. The producer price index climbed by 0.3% month-on-month. However, data on the US construction sector played a negative role, where a very strong drop was recorded. So, the volume of housing starts tumbled by 14.8% in January. The number of building permits issued decreased by 1.5%.
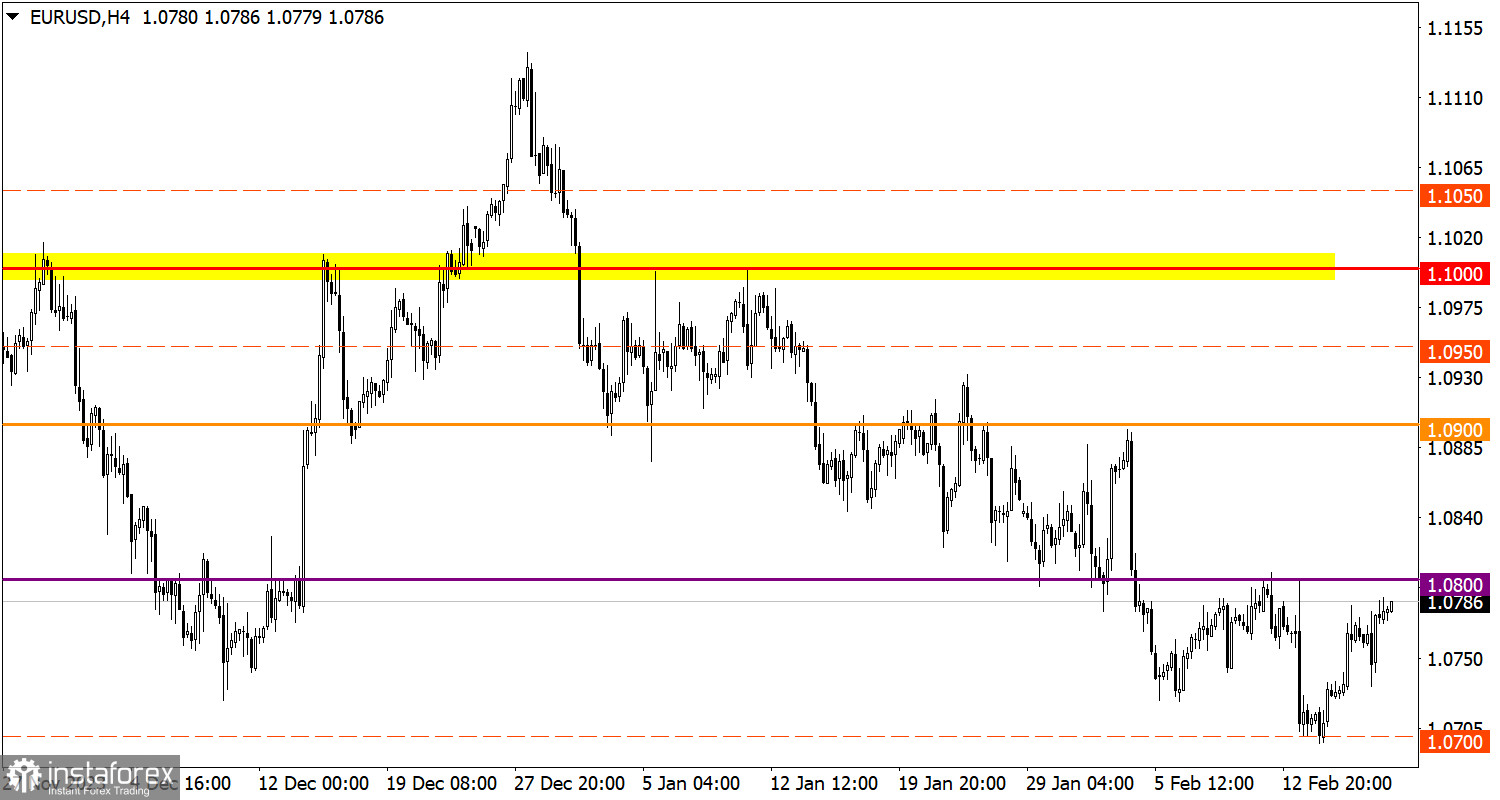
At the beginning of last week, the EUR/USD pair reduced the volume of short positions near the support level of 1.0700. As a result, EUR/USD drifted higher, so the instrument almost reached the level of 1.0800.
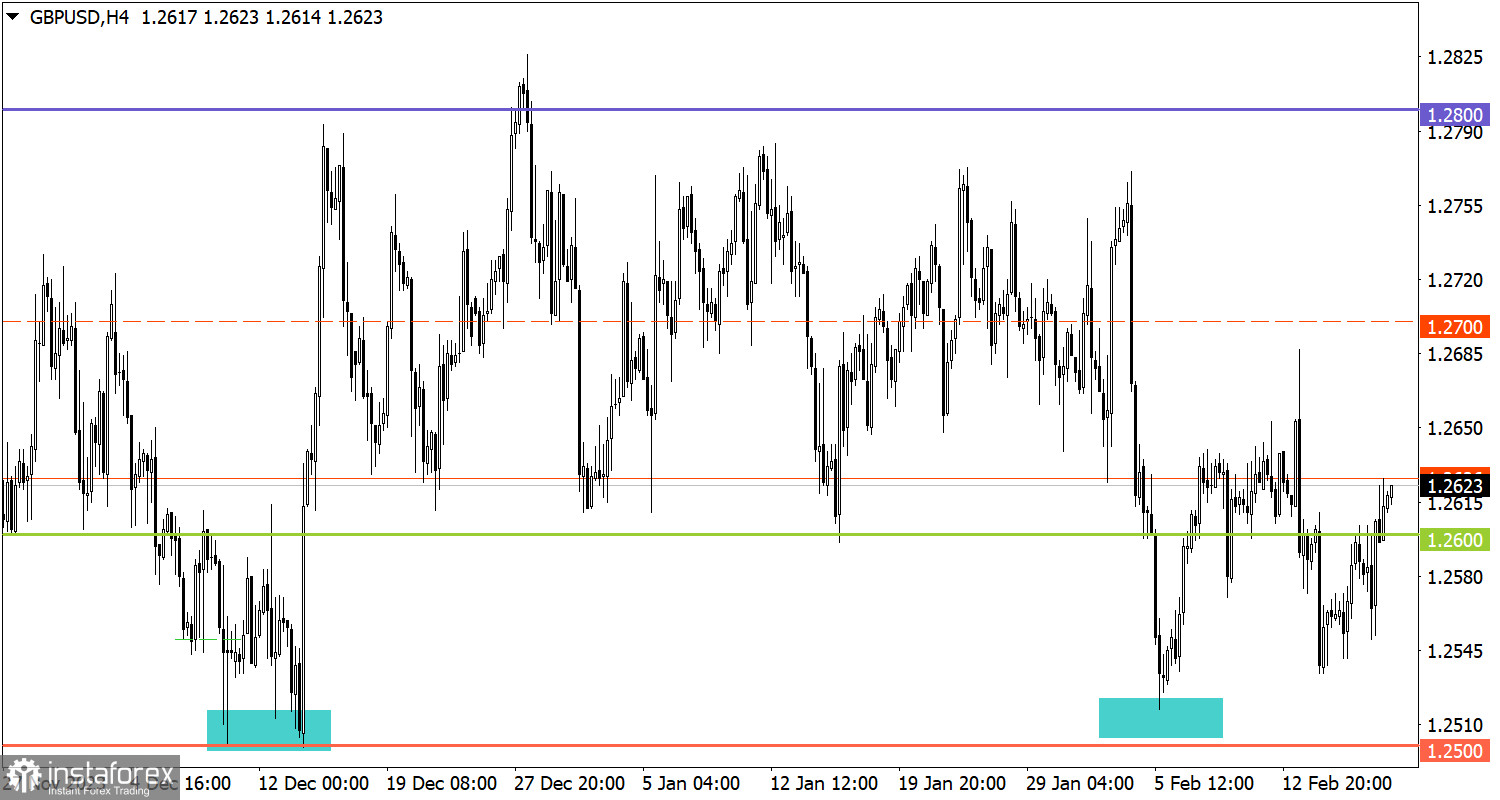
Over the past week, the GBP/USD pair reduced the volume of short positions in the area of the local low of December last year, these are the levels of 1.2500/1.2530. As a result, the instrument pulled back. Therefore, the price rebounded above the level of 1.2600.
Today is not just a blank macroeconomic calendar, but also a day off in the US to celebrate President's Day.
For subsequent growth in the volume of long positions, EUR/USD has to settle above the level of 1.0800 during the day. Otherwise, the level may serve as resistance, strengthening short positions in the direction of 1.070.
If the price settles above 1.2600, this may encourage the strengthening of the pound sterling. In this scenario, GBP/USD may recover to the area of 1.2600/1.2700/1.2800. As for the downward scenario, first, it is necessary to stabilize the price below the level of 1.2600 to increase the chances of the sellers to re-attempt a break through the support area of 1.2500/1.2530.
What's on charts
The candlestick chart type consists of graphic rectangles in white and black with lines at the top and bottom. With a detailed analysis of each individual candle, you can see its characteristics relative to a particular period: opening price, closing price, maximum and minimum price.
Horizontal levels are price coordinates relative to which a price may stop or revered its trajectory. In the market, these levels are called support and resistance.
Circles and rectangles are highlighted examples where the price developed. This color highlighting indicates horizontal lines that may put pressure on the price in the future.
Up/down arrows are guidelines for a possible direction in the future.
*The market analysis posted here is meant to increase your awareness, but not to give instructions to make a trade.
InstaSpot analytical reviews will make you fully aware of market trends! Being an InstaSpot client, you are provided with a large number of free services for efficient trading.


