


Our team has over 7,000,000 traders!
Every day we work together to improve trading. We get high results and move forward.
Recognition by millions of traders all over the world is the best appreciation of our work! You made your choice and we will do everything it takes to meet your expectations!
We are a great team together!
InstaSpot. Proud to work for you!


Actor, UFC 6 tournament champion and a true hero!
The man who made himself. The man that goes our way.
The secret behind Taktarov's success is constant movement towards the goal.
Reveal all the sides of your talent!
Discover, try, fail - but never stop!
InstaSpot. Your success story starts here!

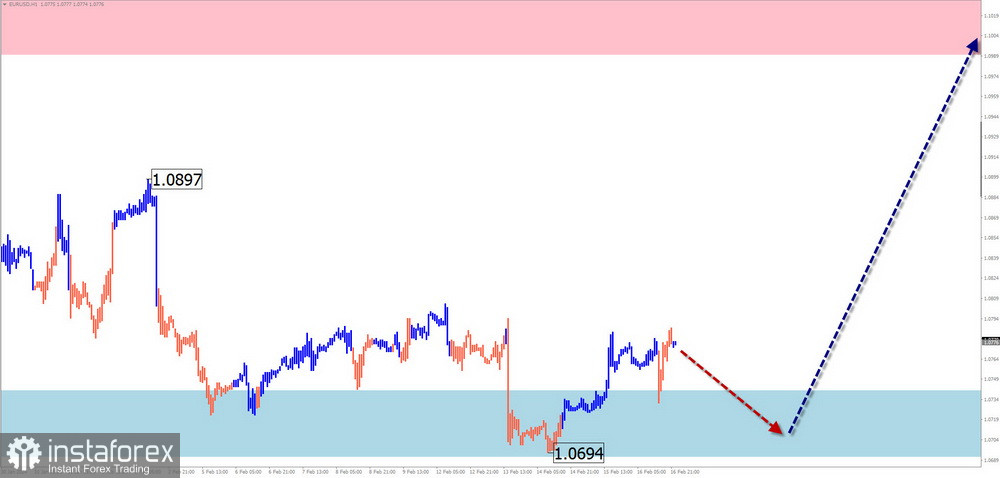
EUR/USD
Analysis:
On the chart of the European currency, a bullish trend that started at the beginning of October last year continues to form. Since the end of December, a complex corrective wave has been developing within this wave. By now, the wave structure has entered the final phase. The price is at the upper boundary of a powerful potential reversal zone.
Forecast:
At the beginning of the week, there is a high probability of the euro's overall sideways movements continuing. Pressure on the support zone is possible with a brief breach of its lower boundary. In the second half of the week, a change in direction and a resumption of price growth can be expected up to the calculated resistance.
Potential reversal zones
Resistance:
Support:
Recommendations:
Selling: there are no safe entry conditions for such transactions in the pair market.
Buying: profitable transactions can occur when confirmed reversal signals appear in the support zone.
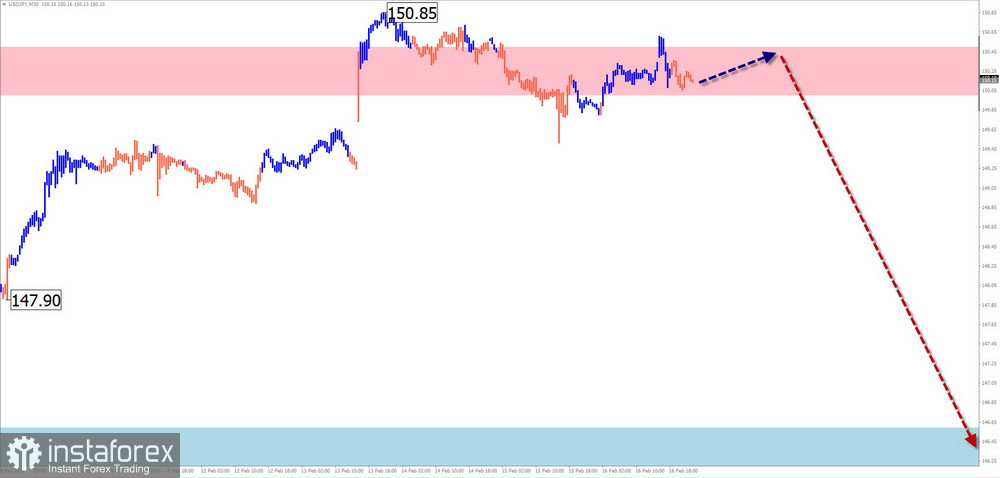
USD/JPY
Analysis:
On the chart of the Japanese yen pair, the direction of price movement has been set by an ascending wave algorithm since the end of last year. In its structure, starting in mid-January, the quotes are undergoing a correction, creating an extended flat pattern. The structure lacks a finishing section (C). At the time of analysis, the price reached the lower boundary of a powerful potential reversal zone in a large timeframe.
Forecast:
The end of the ascending sentiment in the price movement can be expected around the calculated resistance in the next few days. With a high probability, further quotes will drift, forming a reversal. By the weekend, the price will likely resume its decline, down to support boundaries.
Potential reversal zones
Resistance:
Support:
Recommendations:
Buying: there are no conditions for such transactions in the pair market next week.
Selling: may be applied in trading transactions when corresponding reversal signals appear in the calculated resistance area of your TS.
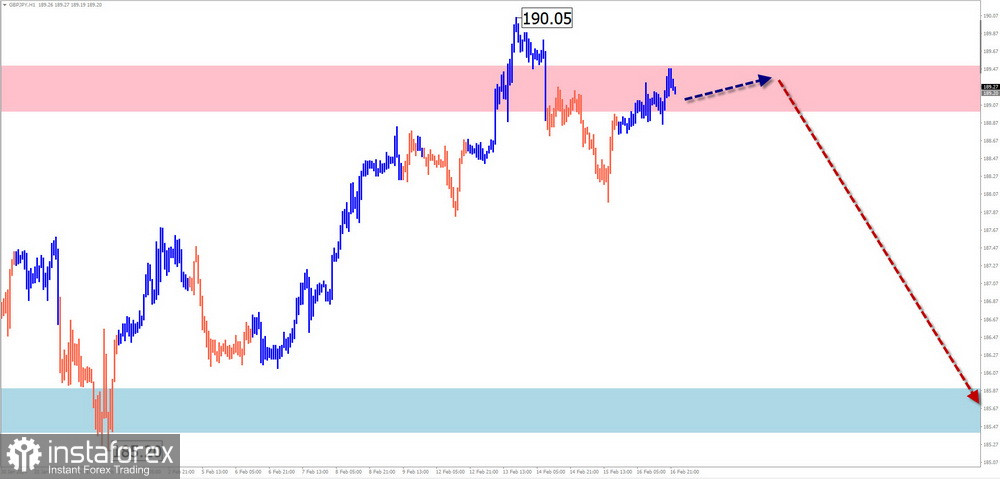
GBP/JPY
Analysis:
The unfinished wave structure of the pound/yen pair is currently upward-oriented. It counts from the beginning of December last year. In the structure of this wave, an unfinished complex correction has been forming over the past month. Quotes are on the weekly chart's lower boundary of a powerful resistance zone.
Forecast:
A price movement between the nearest counter-directional zones is expected during the next weekly period. After possible pressure on the resistance zone, a reversal can be expected. In the second half, a decline is likely down to support boundaries.
Potential reversal zones
Resistance:
Support:
Recommendations:
Buying: has no potential.
Selling: such transactions may become relevant after the appearance of corresponding reversal signals in the resistance zone.
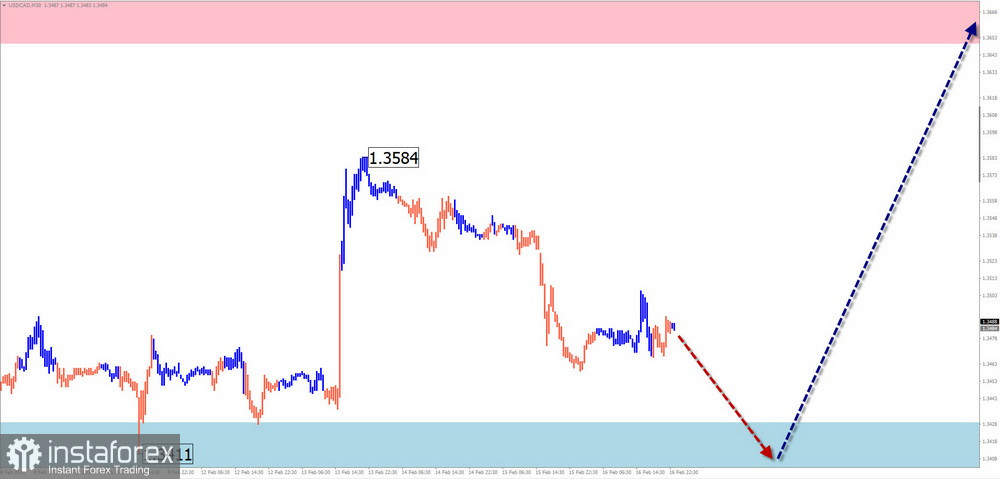
USD/CAD
Analysis:
Starting in November last year, a descending wave has set the main direction on the Canadian dollar chart. Since the end of December, an ascending correction has been forming. The configuration of this wave still needs to be completed. There was an intermediate retracement within a flat pattern throughout the previous month.
Forecast:
In the upcoming weekly period, the continuation of the overall sideways course of movement is expected. At the beginning of the week, a descending vector is more likely. Further, the price will rise to the resistance zone. A change in course may occur by the end of the current or next week.
Potential reversal zones
Resistance:
Support:
Recommendations:
Selling: has low potential and carries a high level of risk.
Buying: can be used in trading transactions after confirmed reversal signals appear in the support zone.
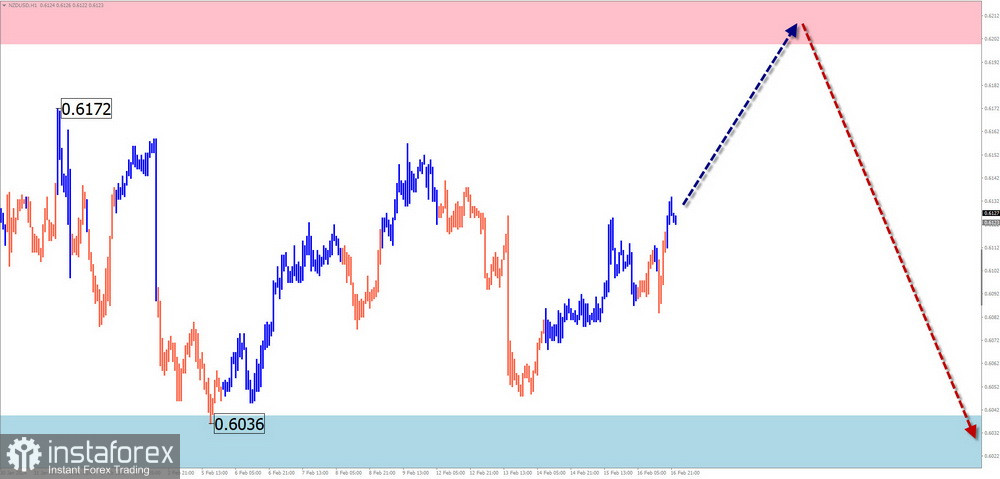
NZD/USD
Analysis:
On the New Zealand dollar chart, the trend direction is set by a descending wave zigzag. The wave counts date back to July of last year. In the wave structure from the end of December, the final part (C) is forming. Within it, an intermediate rollback in a flat has developed over the past month but has yet to be completed.
Forecast:
At the beginning of the upcoming week, the completion of the current ascending sentiment is expected around the calculated resistance. Further, a transition to a flat and a reversal formation is expected. The price drop can be expected closer to the weekend.
Potential reversal zones
Resistance:
Support:
Recommendations:
Buying: can be used with reduced volume within individual sessions.
Selling: before the appearance of reversal signals in the resistance zone.
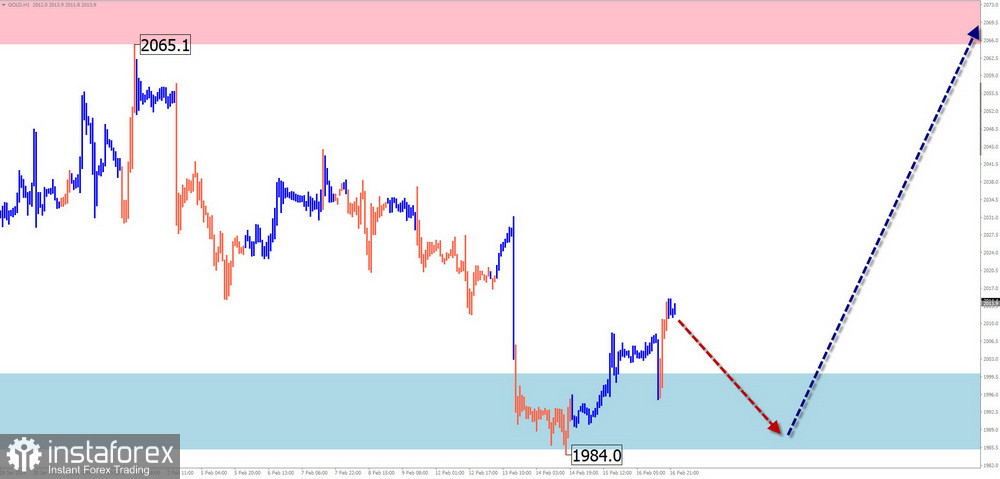
Gold
Analysis:
On the gold chart, the wave level of the descending wave from December 4 of last year does not go beyond the correction of the previous trend section. Over the past month and a half, the wave formed a horizontal "pennant" figure on the chart.
Forecast:
Over the next few days, a price drop to the support zone and a reversal formation can be expected. A resumption of price growth can be expected closer to the weekend.
Potential reversal zones
Resistance:
Support:
Recommendations:
Selling: such transactions are highly risky and can lead to losses.
Buying: suitable conditions for such transactions will arise after the appearance of corresponding reversal signals in the calculated support area on your TS.
Explanation: In simplified wave analysis (SWA), all waves consist of 3 parts (A-B-C). Only the last unfinished wave is analyzed at each TF. Dashed lines show expected movements.
Attention: The wave algorithm does not consider the duration of instrument movements over time!
*The market analysis posted here is meant to increase your awareness, but not to give instructions to make a trade.
InstaSpot analytical reviews will make you fully aware of market trends! Being an InstaSpot client, you are provided with a large number of free services for efficient trading.


