


The legend in the InstaSpot team!
Legend! You think that's bombastic rhetoric? But how should we call a man, who became the first Asian to win the junior world chess championship at 18 and who became the first Indian Grandmaster at 19? That was the start of a hard path to the World Champion title for Viswanathan Anand, the man who became a part of history of chess forever. Now one more legend in the InstaSpot team!


Borussia is one of the most titled football clubs in Germany, which has repeatedly proved to fans: the spirit of competition and leadership will certainly lead to success. Trade in the same way that sports professionals play the game: confidently and actively. Keep a "pass" from Borussia FC and be in the lead with InstaSpot!


GBP/USD continued to trade lower on Wednesday. If on Tuesday, the reason for selling the British currency was the U.S. inflation report, then on Wednesday, it was the UK inflation report. The UK Consumer Price Index for January remained unchanged, although it was expected to rise to 4.2%. Core inflation also remained unchanged, despite expectations of an acceleration to 5.2%. Thus, the results of this report turned out to be more dovish than expected, and the British currency continued to decline.
We do not believe that this report will radically affect the mood of the Monetary Policy Committee, but it is worth noting that the longer inflation grows or does not decrease, the longer the Bank of England will leave the rate at the current level. However, at the same time, it is important to remember that comparisons should be made between forecasts and actual values, not between previous and actual values.
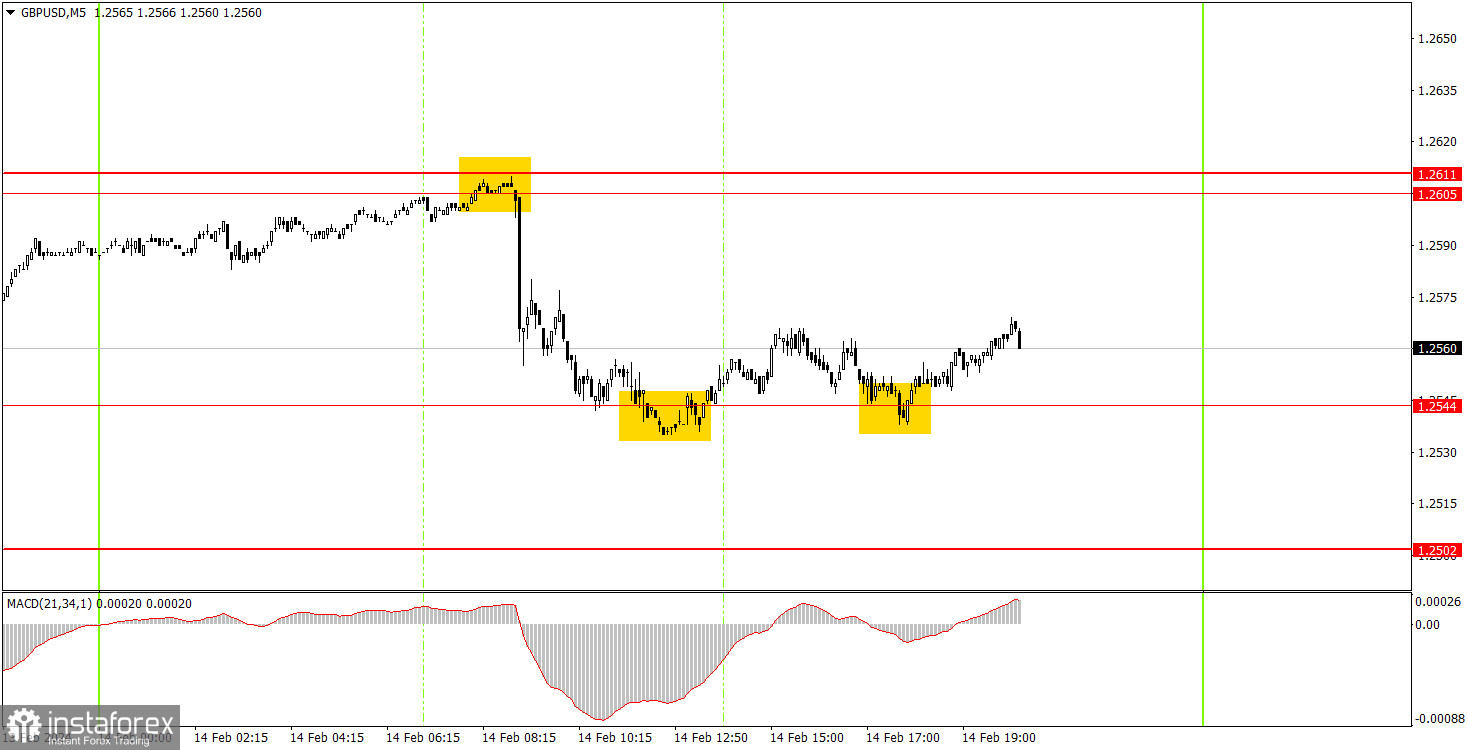
The movements on the 5-minute timeframe were volatile enough for us to expect signals and profit. During the European trading session, a sell signal was formed around 1.2605-1.2611. It was quite difficult to catch it, but it was still possible to enter the market. Subsequently, the pair dropped to the level of 1.2544 and bounced off it twice, forming buy signals. These two signals duplicated each other, so only one long position should have been opened based on them. Market participants could close this trade on Wednesday evening. Overall, the profit from the two trades was 40-50 pips.
On the hourly chart, GBP/USD left the sideways channel of 1.2611-1.2787 and is making every effort to start a downtrend. However, the pound recently declined due to strong reports. In the future, the market may go back to buying for no good reason. If Thursday's UK data turn out to be better than expected, the pound may show strong growth.
The key levels on the 5M chart are 1.2270, 1.2310, 1.2372-1.2387, 1.2457, 1.2502, 1.2544, 1.2605-1.2611, 1.2688, 1.2725, 1.2787-1.2791, 1.2848-1.2860, 1.2913, 1.2981-1.2993. On Thursday, the UK will release reports on industrial production and GDP. The forecasts are weak, but if the latest values exceed them, this can push the pound higher. The U.S. will release secondary reports, such as industrial production and retail sales, which can provoke a market reaction only in the case of a significant deviation of the actual value from the forecast.
1) Signal strength is determined by the time taken for its formation (either a bounce or level breach). A shorter formation time indicates a stronger signal.
2) If two or more trades around a certain level are initiated based on false signals, subsequent signals from that level should be disregarded.
3) In a flat market, any currency pair can produce multiple false signals or none at all. In any case, the flat trend is not the best condition for trading.
4) Trading activities are confined between the onset of the European session and mid-way through the U.S. session, after which all open trades should be manually closed.
5) On the 30-minute timeframe, trades based on MACD signals are only advisable amidst substantial volatility and an established trend, confirmed either by a trendline or trend channel.
6) If two levels lie closely together (ranging from 5 to 15 pips apart), they should be considered as a support or resistance zone.
Support and Resistance price levels can serve as targets when buying or selling. You can place Take Profit levels near them.
Red lines represent channels or trend lines, depicting the current market trend and indicating the preferable trading direction.
The MACD(14,22,3) indicator, encompassing both the histogram and signal line, acts as an auxiliary tool and can also be used as a signal source.
Significant speeches and reports (always noted in the news calendar) can profoundly influence the price dynamics. Hence, trading during their release calls for heightened caution. It may be reasonable to exit the market to prevent abrupt price reversals against the prevailing trend.
Beginners should always remember that not every trade will yield profit. Establishing a clear strategy coupled with sound money management is the cornerstone of sustained trading success.
*The market analysis posted here is meant to increase your awareness, but not to give instructions to make a trade.
InstaSpot analytical reviews will make you fully aware of market trends! Being an InstaSpot client, you are provided with a large number of free services for efficient trading.


