


Our team has over 7,000,000 traders!
Every day we work together to improve trading. We get high results and move forward.
Recognition by millions of traders all over the world is the best appreciation of our work! You made your choice and we will do everything it takes to meet your expectations!
We are a great team together!
InstaSpot. Proud to work for you!


Actor, UFC 6 tournament champion and a true hero!
The man who made himself. The man that goes our way.
The secret behind Taktarov's success is constant movement towards the goal.
Reveal all the sides of your talent!
Discover, try, fail - but never stop!
InstaSpot. Your success story starts here!

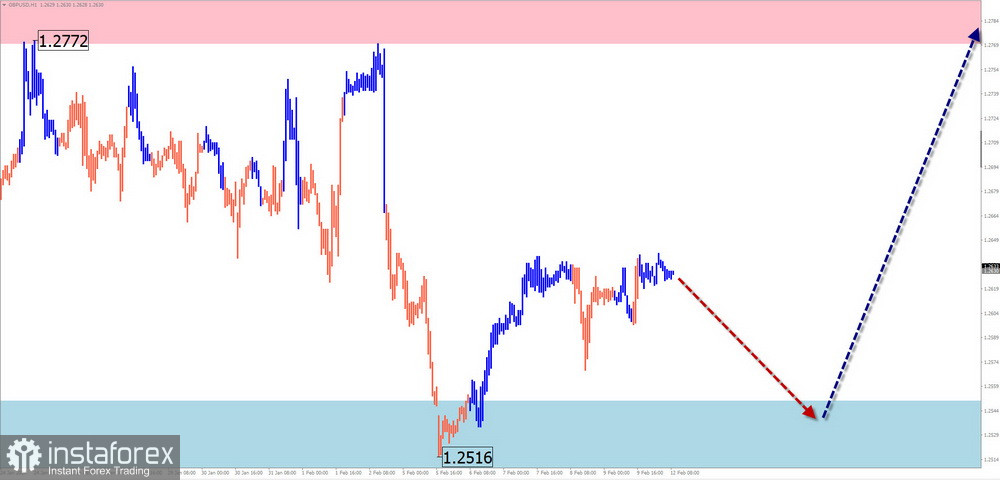
GBP/USD
Analysis:
The algorithm of the descending wave determines the direction of short-term fluctuations in the British pound on the chart since July of the previous year. The middle part (B) is approaching completion in the wave structure. The correction is forming in a horizontal channel between the nearest opposing zones.
Forecast:
At the beginning of this week, a decrease in the price of the British pound to the support zone is probable. In the second half of the week, a reversal and the resumption of the upward course of movement can be expected. The resistance zone limits the range of the pair's weekly growth.
Potential Reversal Zones:
Resistance:
Support:
Recommendations:
Selling: Have low potential and carry a high risk.
Buying: This can be used within intraday after the appearance of corresponding reversal signals at the support zone.
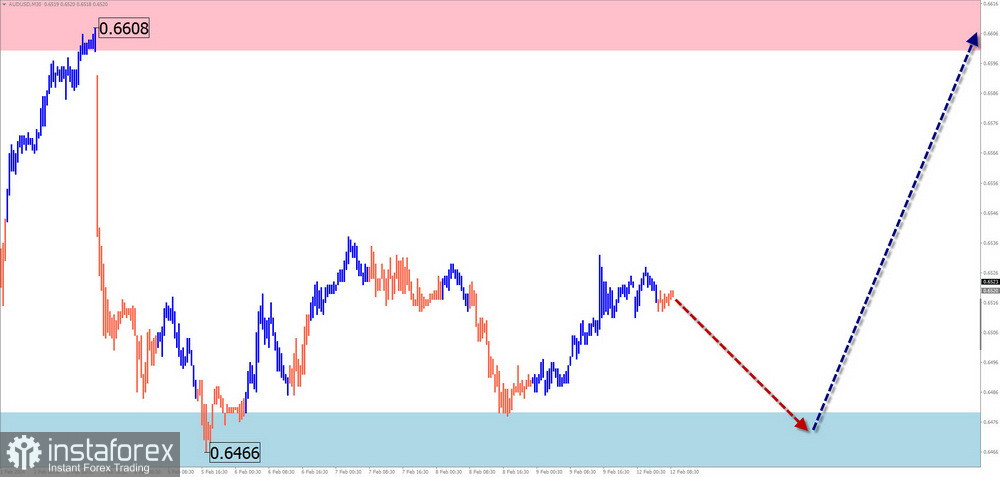
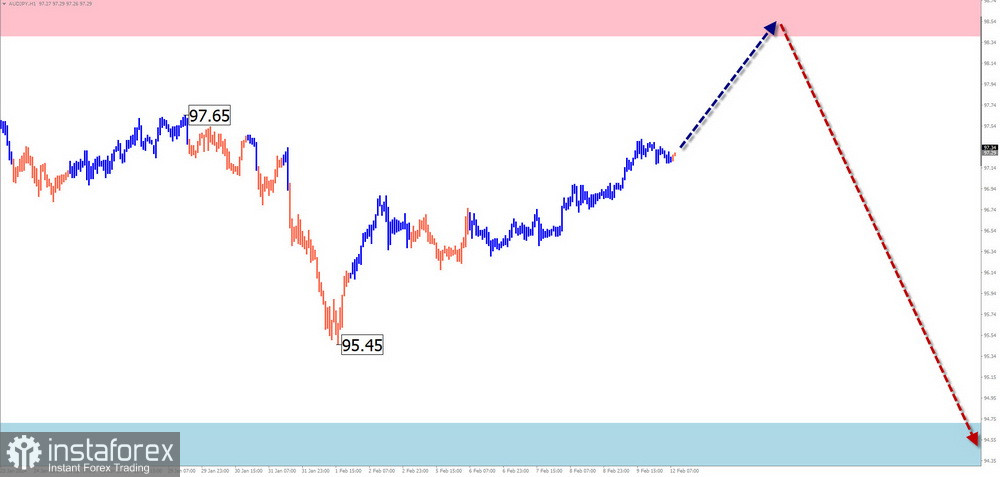
AUD/USD
Analysis:
Since the end of December of the previous year, the primary trend of the Australian dollar has been defined by the bearish wave, reaching the upper boundary of the potential reversal zone of the large timeframe. In the last month, a counter-wave structure in the form of a shifting plane has been developing in the wave structure, showing no signs of completion. The upward segment of the chart from February 6th has reversal potential.
Forecast:
In the next couple of days, a gradual movement of the price towards the levels of the support zone is expected. Subsequently, a reversal and the resumption of the upward movement of the pair can be expected from this zone.
Potential Reversal Zones:
Resistance:
Support:
Recommendations:
Selling: Such transactions may become unprofitable due to the low potential for a decrease.
Buying: These will be in demand only after the appearance of corresponding signals in the support zone using your trading system.
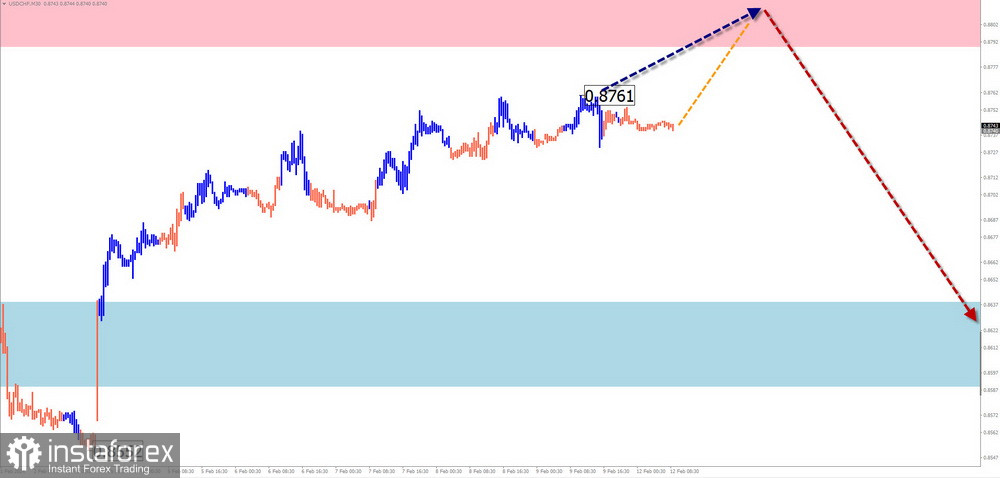
USD/CHF
Analysis:
On the chart of the Swiss Franc, the formation of an upward wave that started at the end of December of the previous year continues. The price is approaching the lower boundary of the preliminary target zone. The wave structure looks completed. There are no signals of an imminent change in direction on the chart.
Forecast:
In the upcoming week, upward movement is expected up to the complete completion of the current price growth in the resistance zone. With a short-term breakthrough of its upper boundary, pressure on the zone is possible. In the second half of the week, a reversal and the resumption of the price decrease can be expected.
Potential Reversal Zones:
Resistance:
Support:
Recommendations:
Buying: Allowed with a fractional volume within individual trading sessions.
Selling: This will be safe after the appearance of reversal signals in the resistance zone using your trading system.
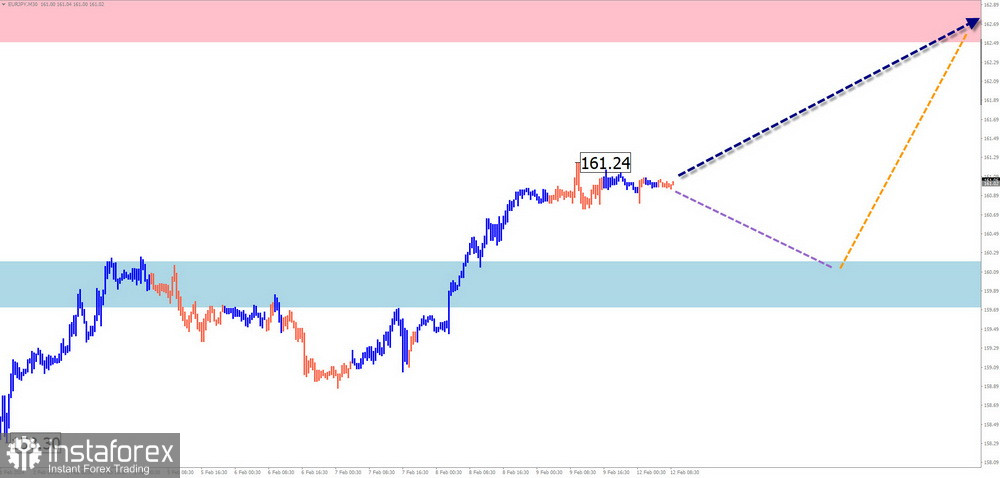
EUR/JPY
Analysis:
After the completed correction in December of the previous year on the chart of the euro/Japanese yen cross pair, the next segment of the main bullish trend of the pair is developing. The price has formed a corrective wave in the structure for the last three weeks. At present, the wave structure does not indicate completion.
Forecast:
In the upcoming weekly period, the continuation of the sideways movement of the price can be expected. In the next couple of days, a repeated decrease in support is not excluded. Closer to the weekend, a reversal and the resumption of the price growth can be expected. The calculated resistance demonstrates the upper limit of the pair's weekly course.
Potential Reversal Zones:
Resistance:
Support:
Recommendations:
Selling: Have low potential and can lead to losses.
Buying: There are no conditions for such transactions in the market pair until the appearance of reversal signals in the calculated support zone.
AUD/JPY
Analysis:
For the past six months, the quotes of the Australian dollar/Japanese yen pair have not had a pronounced trend direction. On the daily chart scale, this segment forms a flat correction in the form of a shifting plane. The wave structure lacks the concluding part.
Forecast:
In the next couple of days, a continuation of the upward movement can be expected up to contact with the resistance zone. After that, a reversal in the flat is expected. The beginning of the price decrease is more likely closer to the weekend.
Potential Reversal Zones:
Resistance:
Support:
Recommendations:
Buying: Allowed with a reduced volume within individual trading sessions. The potential is limited by resistance.
Selling: This will become relevant after the confirmed reversal signals appear in the calculated resistance zone.
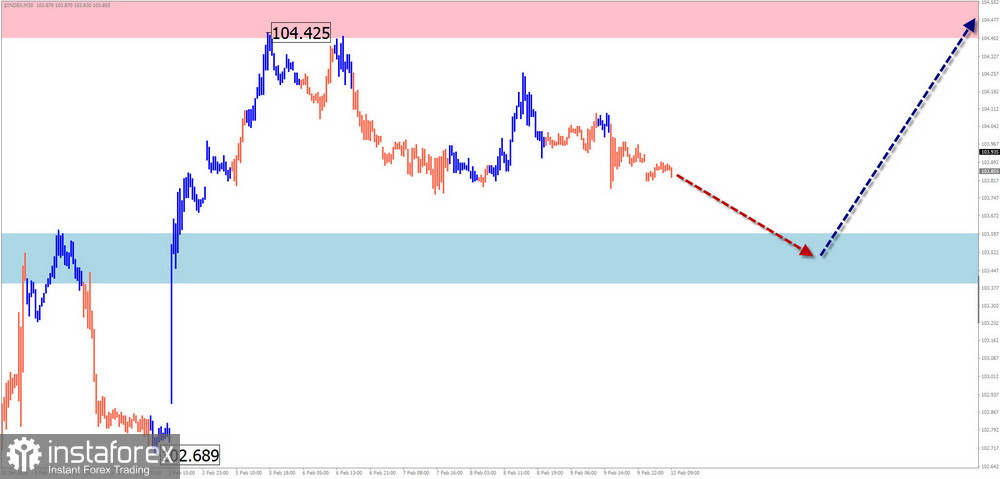
US Dollar Index
Brief Analysis:
Since December of the previous year, the direction of the US Dollar Index quotes has been determined by the algorithm of the unfinished upward wave. Since February 5th, the index values have been moving in a sideways plane. The wave level of the current decrease suggests the development of a full correction.
Week Forecast:
In the upcoming week, the completion of the downward course of the index movement is expected. In the area of the calculated support, a reversal can be expected. The beginning of the course growth is likely towards the end of this week or the beginning of the next.
Potential Reversal Zones:
Resistance:
Support:
Recommendations:
The low potential for a decrease in the USDollar Index limits conditions for buying in major pairs in the coming weeks. Counterparty sales in majors will be in demand after the formation of reversal signals in the support zone of your trading systems.
Note: In Simplified Wave Analysis (SWA), all waves consist of 3 parts (A-B-C). Only the last unfinished wave is analyzed in each timeframe. Dashed lines indicate expected movements.
Attention: The wave algorithm does not consider the duration of movements in the instruments over time!
*The market analysis posted here is meant to increase your awareness, but not to give instructions to make a trade.
InstaSpot analytical reviews will make you fully aware of market trends! Being an InstaSpot client, you are provided with a large number of free services for efficient trading.


