


Our team has over 7,000,000 traders!
Every day we work together to improve trading. We get high results and move forward.
Recognition by millions of traders all over the world is the best appreciation of our work! You made your choice and we will do everything it takes to meet your expectations!
We are a great team together!
InstaSpot. Proud to work for you!


Actor, UFC 6 tournament champion and a true hero!
The man who made himself. The man that goes our way.
The secret behind Taktarov's success is constant movement towards the goal.
Reveal all the sides of your talent!
Discover, try, fail - but never stop!
InstaSpot. Your success story starts here!

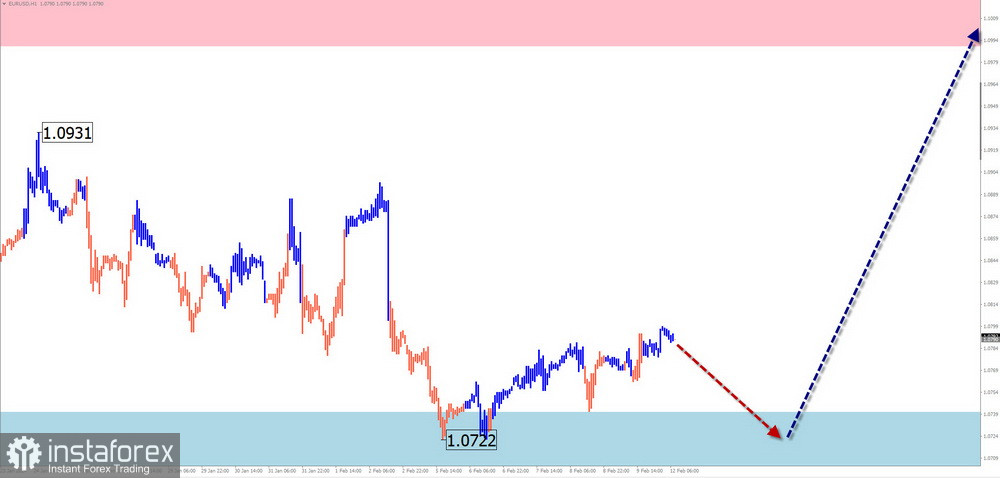
EUR/USD
Analysis:
The bullish wave of the European currency that began in October of the previous year has returned the major trend to the upward tracks. Since late December, the price has been moving within a flat, forming a corrective part (B). Its structure, at the time of analysis, does not indicate completion.
Forecast:
Euro quotes are expected to continue the overall sideways movement in the upcoming week. Pressure on the support zone is likely in the next couple of days. Subsequently, a reversal and the beginning of an upward trajectory can be anticipated. Price growth is not expected to be beyond the resistance zone.
Potential Reversal Zones:
Resistance:
Support:
Recommendations:
Buying: This will be available after the appearance of corresponding reversal signals in your trading system near the resistance zone.
Selling: Possible with reduced volume within intraday, pending the first signs of a change in direction.
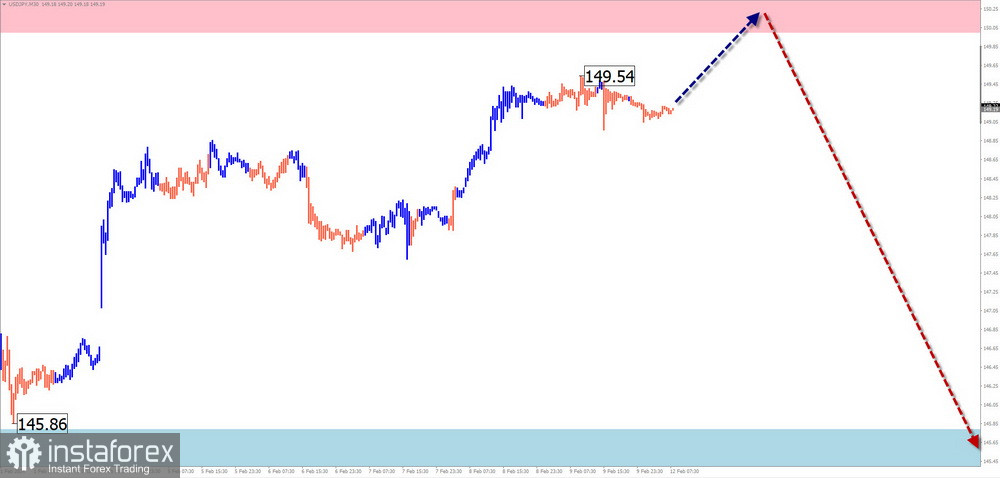
USD/JPY
Analysis:
A downtrend has dominated the main pair of the Japanese yen since December of the previous year. An unfinished corrective segment has been reported since mid-January. Quotes form a horizontal stretched flat between the nearest areas of opposite directions. The structure of this wave is close to completion.
Forecast:
The likely scenario is continuing price movement within the established price channel in the upcoming week. After probable pressure on the resistance zone in the coming days, a change in direction and the start of a price decrease can be expected.
Potential Reversal Zones:
Resistance:
Support:
Recommendations:
Buying: There will be no conditions for such transactions in the market pair in the coming week.
Selling: This will become possible after the appearance of reversal signals within the calculated resistance.
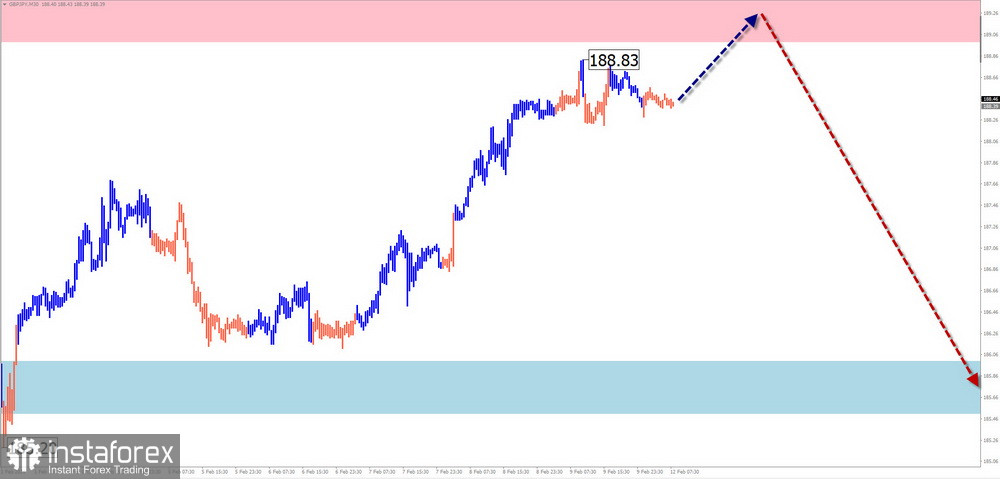
GBP/JPY
Analysis:
Since the beginning of December of the previous year, the chart of the pair of the British pound against the Japanese yen has continued to form a wave zigzag in the "north" of the chart. The unfinished corrective segment reached the borders of a powerful reversal zone at the time of the analysis. Before resuming the price growth, it is necessary to complete the current wave down.
Forecast:
During the next week, movement in price is expected predominantly in a sideways channel. An upward vector is more likely in the coming days. A reversal and the resumption of the price decline can be expected in the resistance zone. A breakthrough below support levels this week is unlikely.
Potential Reversal Zones:
Resistance:
Support:
Recommendations:
Buying: Possible with reduced volume within individual sessions.
Selling: Will become a priority for trading deals after the appearance of corresponding reversal signals in the resistance zone.
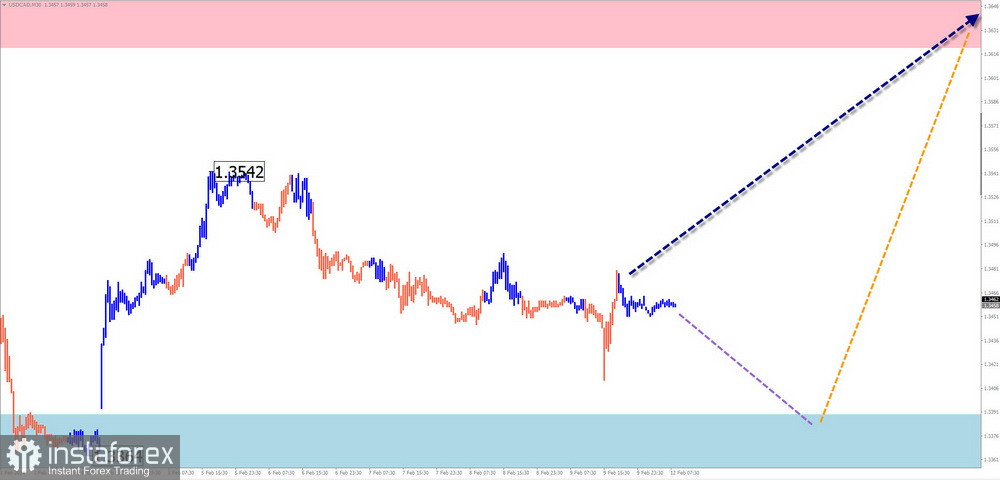
USD/CAD
Analysis:
The direction of the movement of the main pair of the Canadian dollar in the short term is determined by the algorithm of the up-wave from December 27th of the previous year. Since mid-January, quotes in a flat have been forming a descending shifting plane. The structure of the wave lacks a concluding part.
Forecast:
A short-term price decrease is possible in the next few days but not lower than the support zone levels. After that, a reversal and the continuation of the upward vector can be expected, with an increase in the pair's rate to the calculated resistance borders.
Potential Reversal Zones:
Resistance:
Support:
Recommendations:
Buying: Will become possible after the appearance of corresponding reversal signals in the support zone.
Selling: Can be used with a fractional lot within individual sessions.
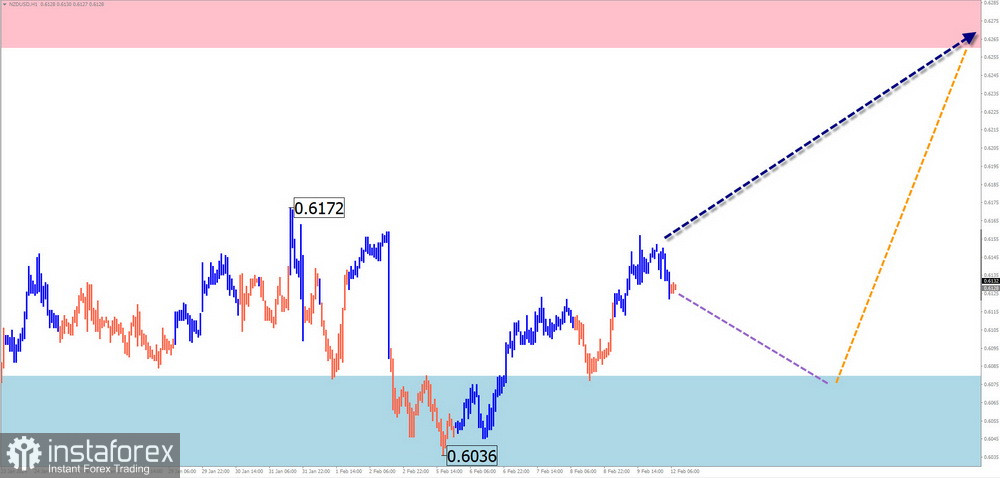
NZD/USD
Analysis:
The direction of the short-term trend of the major pair of the New Zealand dollar is determined by the algorithm of the descending wave since mid-July of the previous year. In the structure of this wave, the concluding part, reporting from the end of December, is developing. The price has been moving sideways in the last four weeks, forming a corrective part (B) within the main wave.
Forecast:
A predominantly upward trajectory of the price movement is expected throughout the coming week. Short-term decreases, not lower than the support zone, are included in the first days. The highest volatility is likely closer to the weekend.
Potential Reversal Zones:
Resistance:
Support:
Recommendations:
Selling: Admissible with a reduced lot within individual sessions.
Buying: This can be used in trading transactions after confirmed reversal signals appear in the support zone.
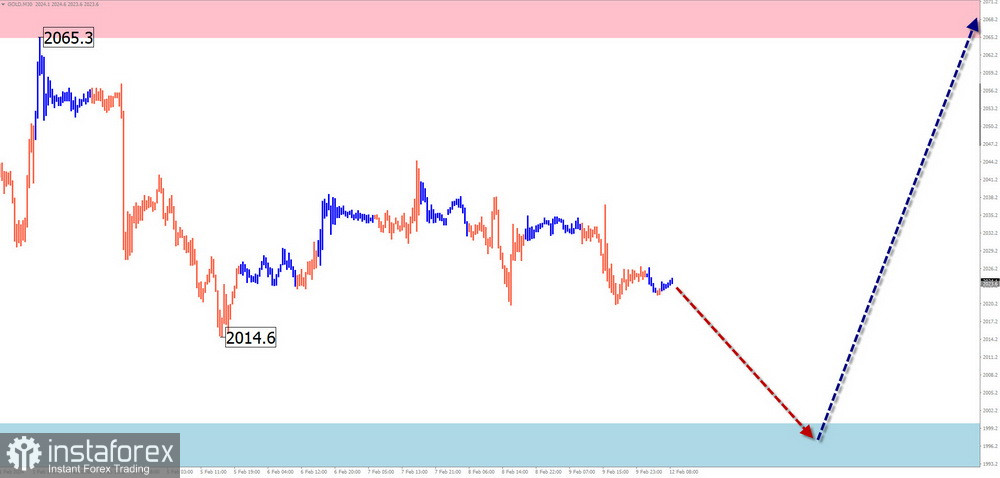
Gold
Analysis:
On the gold chart since September of the previous year, the formation of an upward wave continues. Quotes reached values of a large potential reversal zone. The unfinished segment from December 4th corrects the previous trend. The structure of this wave does not show signs of completion at the time of analysis.
Forecast:
There is a high probability of completing the descending flat in the calculated support zone in the upcoming trading sessions. After that, a reversal and the resumption of the price growth can be expected. A brief breakthrough below the lower boundary cannot be ruled out with a change in direction.
Potential Reversal Zones:
Resistance:
Support:
Recommendations:
Selling: Similar transactions carry a high risk in the coming days.
Buying: Will become relevant after the appearance of confirmed reversal signals in the resistance zone.
Note: In Simplified Wave Analysis (SWA), all waves consist of 3 parts (A-B-C). Only the last unfinished wave is analyzed in each timeframe. Dashed lines indicate expected movements.
Attention: The wave algorithm does not consider the duration of movements in the instruments over time!
*The market analysis posted here is meant to increase your awareness, but not to give instructions to make a trade.
InstaSpot analytical reviews will make you fully aware of market trends! Being an InstaSpot client, you are provided with a large number of free services for efficient trading.


