


Our team has over 7,000,000 traders!
Every day we work together to improve trading. We get high results and move forward.
Recognition by millions of traders all over the world is the best appreciation of our work! You made your choice and we will do everything it takes to meet your expectations!
We are a great team together!
InstaSpot. Proud to work for you!


Actor, UFC 6 tournament champion and a true hero!
The man who made himself. The man that goes our way.
The secret behind Taktarov's success is constant movement towards the goal.
Reveal all the sides of your talent!
Discover, try, fail - but never stop!
InstaSpot. Your success story starts here!

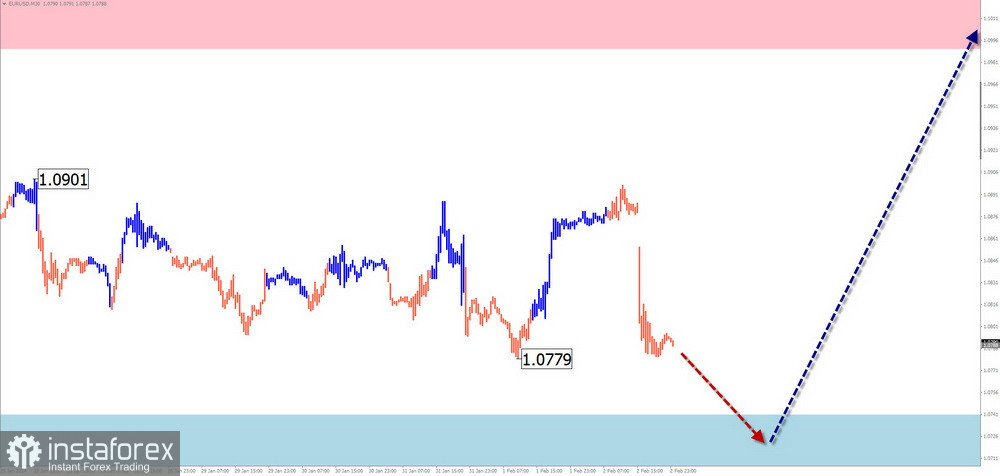
EUR/USD
Analysis:
The ascending wave algorithm has determined the price movement direction of the major euro pair since October of the previous year. A corrective pattern has been developed in the wave structure since the beginning of this year. Its structure is close to completion. The price is approaching the upper boundary of the large-scale resistance zone.
Forecast:
In the first half of the upcoming week, a downward shift in the euro's price is likely toward the support zone. In this zone, a stop and reversal formation can be expected. The resumption of price growth is anticipated by the end of the week.
Potential Reversal Zones
Resistance:
Support:
Recommendations:
Buying: Premature until confirmed reversal signals appear near the support zone.
Selling: Possible with a fractional volume, intraday, closing the deal at the first reversal signals.
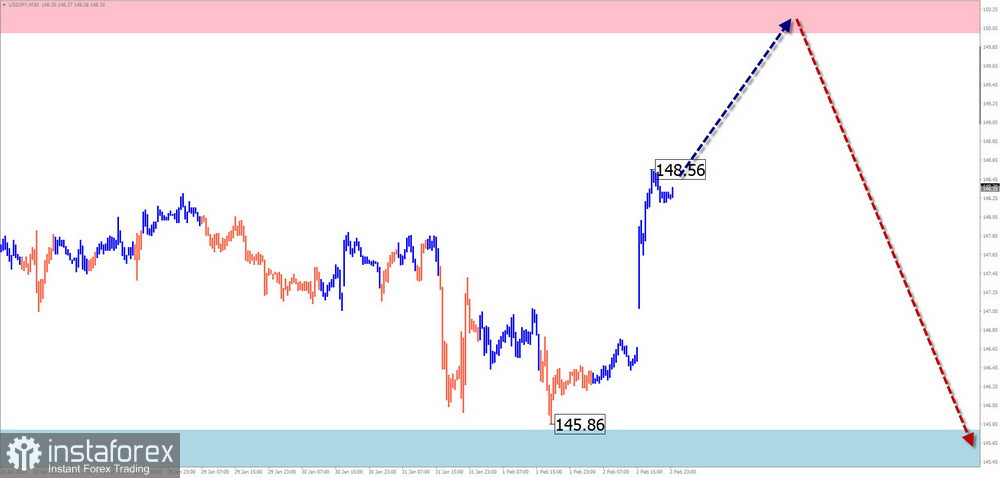
USD/JPY
Analysis:
The current bullish wave of the main Japanese yen pair has been reported since mid-July of last year. The analysis of the structure indicates that the final part (C) has been developing in the structure since December 28th. On the pair's chart, quotes in the last two weeks have formed an intermediate correction in the form of a shifting plane.
Forecast:
In the next couple of days, an overall sideways trend in price movement can be expected, shifting towards the calculated resistance zone. The second half of the week may become more volatile. A reversal and resumption of downward price movement are likely. The support zone limits the range of the pair's weekly movement.
Potential Reversal Zones
Resistance:
Support:
Recommendations:
Buying: Fractional volumes can be used in intraday trading.
Selling: Possible with reduced volumes after confirmed reversal signals within the resistance zone.
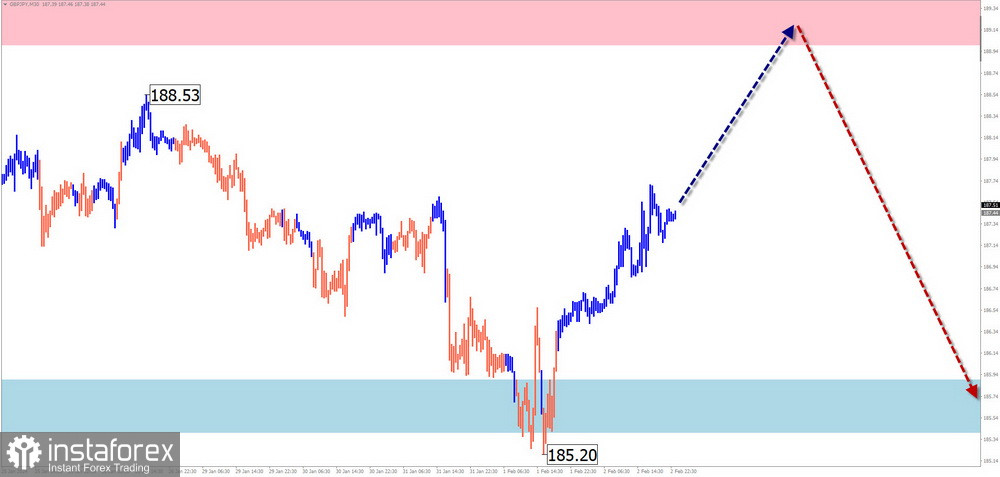
GBP/JPY
Analysis:
On the chart of the Japanese yen against the British pound pair, the most interesting aspect for trading is the last unfinished upward wave since December 7th of the previous year. This segment marked the beginning of the final part (C) in a larger wave structure on the higher timeframe. Throughout the past month, the price has mostly moved sideways between the nearest zones of opposing directions.
Forecast:
The likely scenario for the upcoming week is continuing the pair's price movement sideways. In the first few days, upward price movement towards the resistance zone is possible. A resumption of downward price movement can be expected closer to the weekend.
Potential Reversal Zones
Resistance:
Support:
Recommendations:
Buying: Fractional volumes are possible in intraday trading.
Selling: Prioritized for trading deals after confirmed reversal signals within the resistance zone.
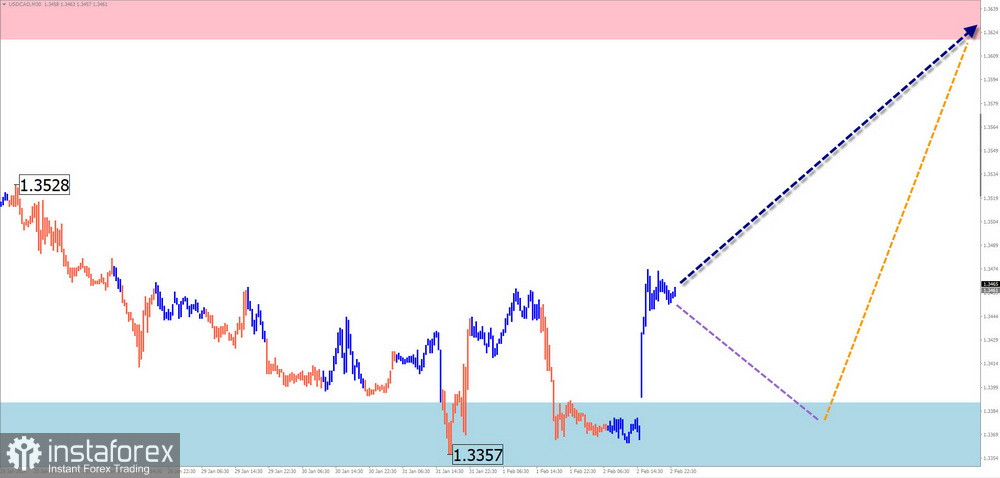
USD/CAD
Analysis:
In the short term, the trend direction of the major Canadian dollar pair has been determined by the ascending wave algorithm since the end of last year. The unfinished part of the wave in the last two weeks forms a correction that was not completed at the time of analysis. In the area of the preliminary target zone, there is a powerful potential reversal zone of the daily timeframe.
Forecast:
After a probable attempt to exert pressure on the support zone on the pair's chart, the formation of a reversal and a return to the overall upward trend can be expected. The upper boundary of the potential reversal zone of the weekly chart passes through the calculated resistance area.
Potential Reversal Zones
Resistance:
Support:
Recommendations:
Selling: Conditions for such deals on the pair's market are risky.
Buying: Possible with fractional volumes after confirmed signals appear in the support zone.
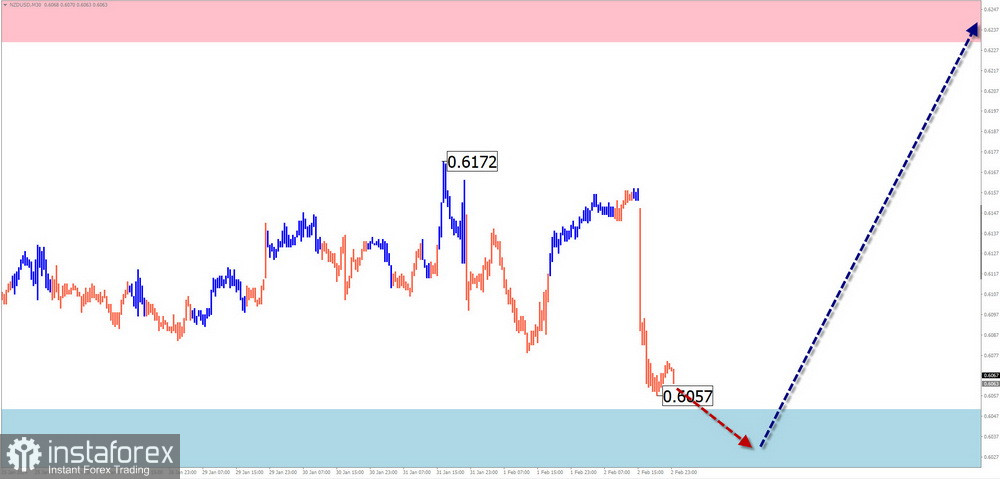
NZD/USD
Analysis:
The direction of price fluctuations of the New Zealand dollar can be seen when analyzing the daily chart. The unfinished wave structure has a downward direction, starting from mid-July last year. The final part of the wave (C) started at the end of last December. The wave looks completed, but there are no reversal signals. Quotes reached the boundaries of the potential reversal zone.
Forecast:
In the next few days, the formation of a reversal around the calculated support can be expected. Pressure on the zone is possible with a short-term breakthrough of its lower support boundary. The highest activity can be expected closer to the weekend.
Potential Reversal Zones
Resistance:
Support:
Recommendations:
Selling: No conditions for deals are expected next week.
Buying: Possible after confirmed signals appear in your trading system in the support area.
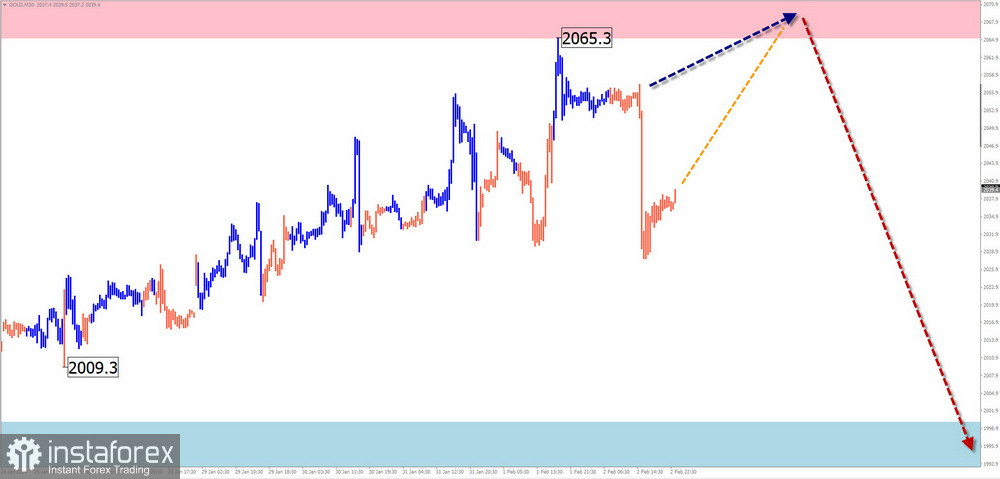
Gold
Analysis:
The ascending wave algorithm has determined the direction of gold price fluctuations since October of last year. From December 4th, a corrective wave (B) has been developing. Quotes move sideways within the boundaries of the potential reversal zone of the weekly chart. The wave structure does not show completion at the time of analysis.
Forecast:
At the beginning of the upcoming week, with a high probability, the gold price will drift along the boundaries of the calculated resistance. After the formation of a reversal, a resumption of downward price movement and a rollback to the support area can be expected.
Potential Reversal Zones
Resistance:
Support:
Recommendations:
Buying: Such deals in the next few days will not have potential and carry a high risk.
Sells: This will become relevant after confirmed reversal signals appear in the resistance zone.
Notes: In the simplified wave analysis (SWA), all waves consist of 3 parts (A-B-C). On each timeframe, the latest, unfinished wave is analyzed. Dashed lines indicate expected movements.
Attention: The wave algorithm does not consider the duration of instrument movements in time!
*The market analysis posted here is meant to increase your awareness, but not to give instructions to make a trade.
InstaSpot analytical reviews will make you fully aware of market trends! Being an InstaSpot client, you are provided with a large number of free services for efficient trading.


