


Our team has over 7,000,000 traders!
Every day we work together to improve trading. We get high results and move forward.
Recognition by millions of traders all over the world is the best appreciation of our work! You made your choice and we will do everything it takes to meet your expectations!
We are a great team together!
InstaSpot. Proud to work for you!


Actor, UFC 6 tournament champion and a true hero!
The man who made himself. The man that goes our way.
The secret behind Taktarov's success is constant movement towards the goal.
Reveal all the sides of your talent!
Discover, try, fail - but never stop!
InstaSpot. Your success story starts here!

On Wednesday, the macroeconomic calendar remained empty, with no important statistical data published in the European Union, the United Kingdom, or the United States. However, within the context of the information flow, there was a speech by the Vice-President of the European Central Bank (ECB), Luis de Guindos. In his address, he almost directly stated that the regulator would be one of the first to begin easing its monetary policy. This statement garnered significant interest, but the market reacted to it cautiously.
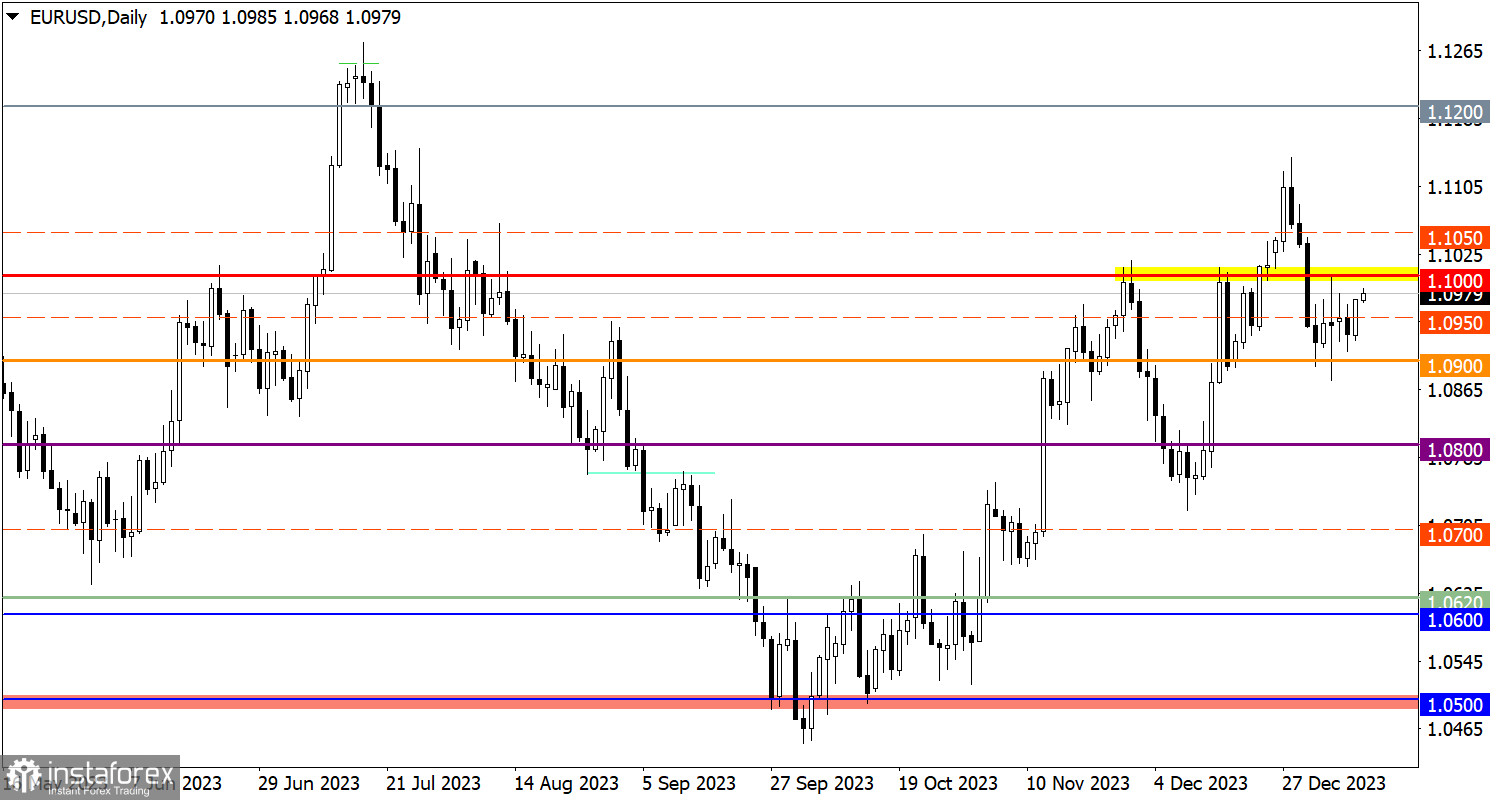
Despite the euro's appreciation against the dollar, the quote ended the previous day within the confines of recent stagnation.
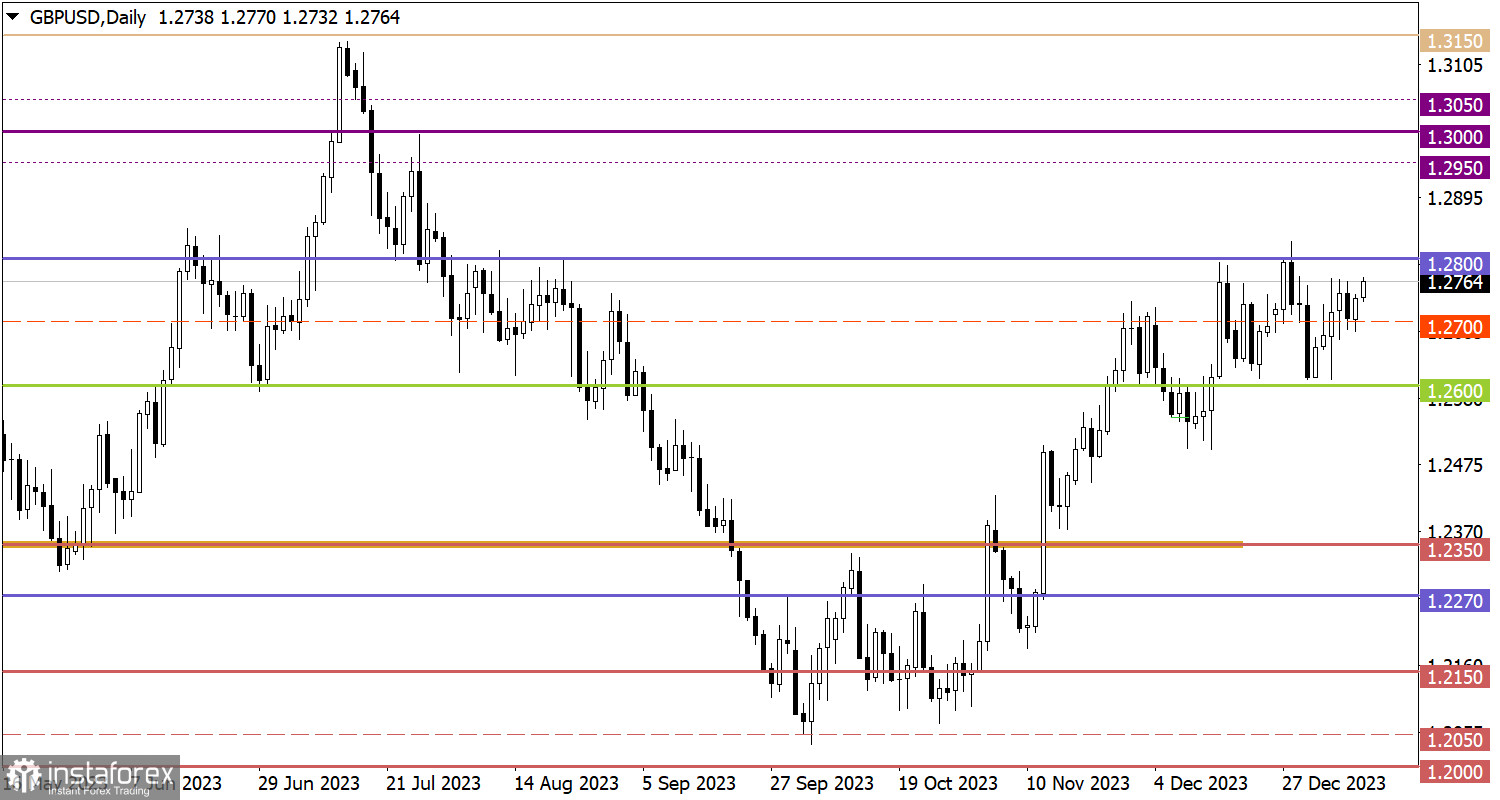
The GBP/USD currency pair demonstrated an upward dynamic, based on which the price nearly reached the upper limit of the lateral channel 1.2600/1.2800.

Today is a key day in terms of the macroeconomic calendar, as inflation data in the United States is expected to be published. According to forecasts from analytical agencies, inflation is expected to remain at the previous level of 3.1%. However, the consensus forecast suggests an increase to 3.2%. An inflation rise would slow down the process of considering a scenario for easing monetary policy sooner, which could support the value of the U.S. currency.
Buyers face resistance at the 1.1000 level, approaching which could lead to an increase in short positions. In this scenario, the quote might return below the 1.0950 mark. Nevertheless, a sustained stabilization of the price above the 1.1000 level, at least on a four-hour chart, could contribute to further growth of the euro. This price move would indicate a recovery of the euro's value after a correction cycle.
From a technical analysis standpoint, the tactic of working based on a lateral channel is divided into two stages: rebound and breakout. The first stage involves temporary fluctuation, which ultimately leads to the accumulation of trading forces and transition to the second stage. The breakout method represents the main stage, which can lead to subsequent price movement.
The candlestick chart type is white and black graphic rectangles with lines above and below. With a detailed analysis of each individual candle, you can see its characteristics relative to a particular time frame: opening price, closing price, intraday high and low.
Horizontal levels are price coordinates, relative to which a price may stop or reverse its trajectory. In the market, these levels are called support and resistance.
Circles and rectangles are highlighted examples where the price reversed in history. This color highlighting indicates horizontal lines that may put pressure on the asset's price in the future.
The up/down arrows are landmarks of the possible price direction in the future.
*The market analysis posted here is meant to increase your awareness, but not to give instructions to make a trade.
InstaSpot analytical reviews will make you fully aware of market trends! Being an InstaSpot client, you are provided with a large number of free services for efficient trading.


