


The legend in the InstaSpot team!
Legend! You think that's bombastic rhetoric? But how should we call a man, who became the first Asian to win the junior world chess championship at 18 and who became the first Indian Grandmaster at 19? That was the start of a hard path to the World Champion title for Viswanathan Anand, the man who became a part of history of chess forever. Now one more legend in the InstaSpot team!


Borussia is one of the most titled football clubs in Germany, which has repeatedly proved to fans: the spirit of competition and leadership will certainly lead to success. Trade in the same way that sports professionals play the game: confidently and actively. Keep a "pass" from Borussia FC and be in the lead with InstaSpot!

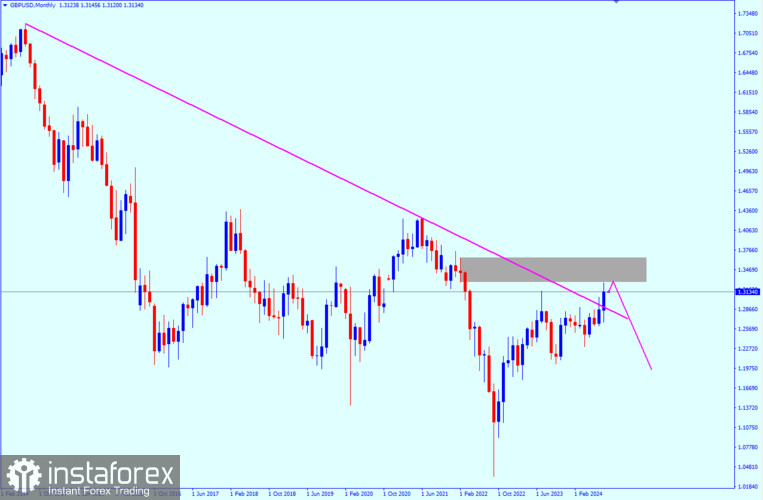
Monthly chart
In the monthly time frame, the GBP/USD pair broke a downtrend line that lasted for more than 10 years. However, this break could be false and GBP/USD will not be able to continue rising after this break. It is targeting liquidity above the trend line and will rebound from the order zone at 1.3280. From this area, we may see some bearish signals such as price action or a bearish structure.
Weekly chart
The weekly time frame also supports the decline because the trend is still bearish and there is an additional signal that supports the decline from the order block of 1.3488, which is the presence of an IDM before this level. The IDM is like liquidity that attracts traders to enter from areas before the real bounce happens, and the GBP/USD pair will target breaking the internal upward trend.
Daily chart
There are not many opportunities in the daily time frame, but there is a liquidity void, which is a sign that the pair needs to make some corrections before continuing the rise. This is actually a good sign to target the order block on the weekly time frame. To reach that order block, the instrument will bounce from 1.2871 (order block) or from the 61.8 Fibonacci level. These are considered important levels for the bounce, and then we will see a strong rise after that.
4-hour chart
If you want to enter a trade until the price reaches the appropriate areas in the daily time frame, there is a good area to enter sell from the level of 1.31642. This area is considered an order flow zone, as the price bounced from the order block above it, and then I expect it to do the same thing from this zone, especially since a Shift in Structure occurred. This is a good signal for the start of the downward trend in the four hours.
Points of interest (POI)
Sell from: 1.31642 (from OB with the Order flow)
TP 1: 1.30537 (maybe will rebound from there)
TP 2: 1.2900 (will continue the bullish movements in the daily)
Stop loss: 1.3200 (above the OB)
*The market analysis posted here is meant to increase your awareness, but not to give instructions to make a trade.
InstaSpot analytical reviews will make you fully aware of market trends! Being an InstaSpot client, you are provided with a large number of free services for efficient trading.


