


Our team has over 7,000,000 traders!
Every day we work together to improve trading. We get high results and move forward.
Recognition by millions of traders all over the world is the best appreciation of our work! You made your choice and we will do everything it takes to meet your expectations!
We are a great team together!
InstaSpot. Proud to work for you!


Actor, UFC 6 tournament champion and a true hero!
The man who made himself. The man that goes our way.
The secret behind Taktarov's success is constant movement towards the goal.
Reveal all the sides of your talent!
Discover, try, fail - but never stop!
InstaSpot. Your success story starts here!

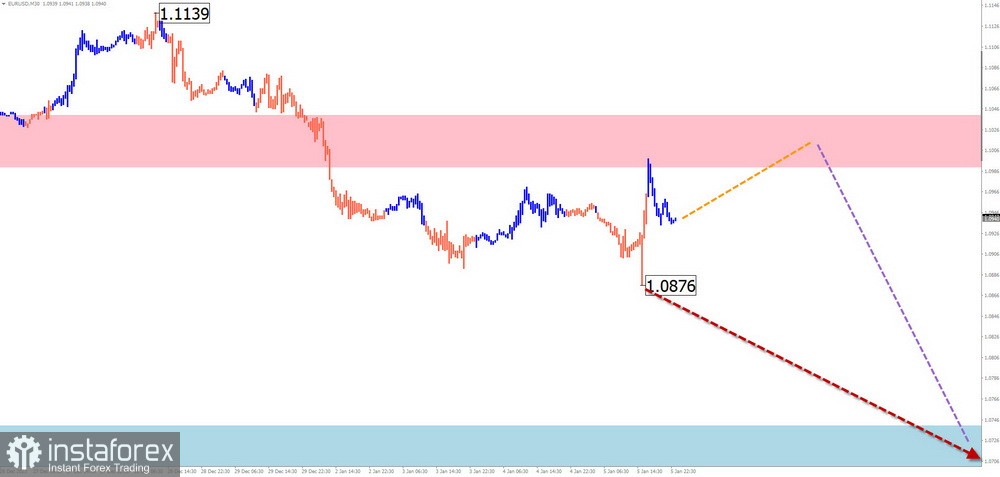
EUR/USD
Analysis:
On the euro chart, a downward trend has dominated since the beginning of the previous year. Since September 26th, a corrective wave began to counter the main movement and has not yet been completed. At the end of last year, the price bounced off a strong potential reversal zone. The wave level of the downward movements has yet to exceed the retracement boundaries.
Forecast:
In the upcoming days, the euro price is expected to move within a range between the nearest opposing zones. After potential pressure on the resistance zone, a change in the direction of the price movement and the beginning of a price decline can be anticipated. The calculated support zone limits the maximum expected weekly downward movement.
Potential Reversal Zones:
Resistance:
Support:
Recommendations:
Buy: Considered risky and not recommended.
Sell: Selling positions can be used in trading after corresponding confirmed reversal signals appear near the resistance area.
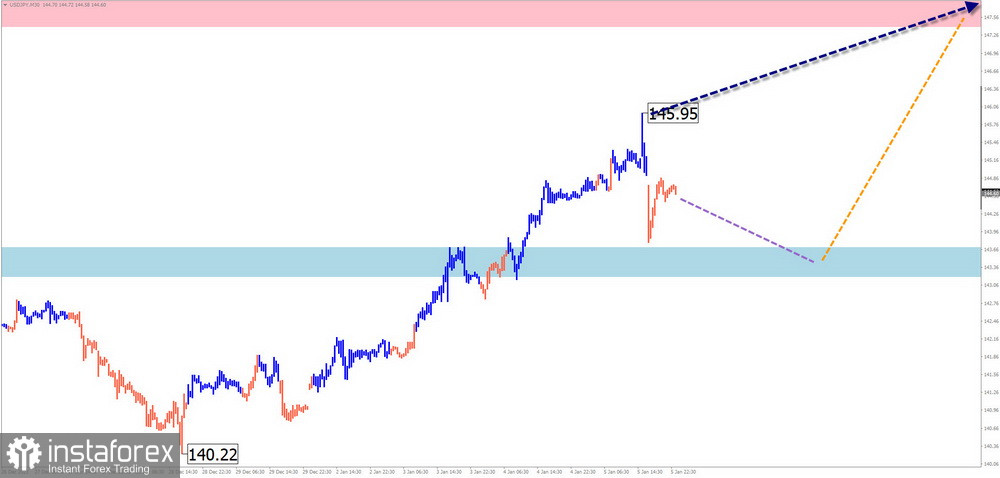
USD/JPY
Analysis:
The trend in recent years has been the weakening of the Japanese yen against the North American Dollar. A major upward trend in the middle of November last year was interrupted by a counter-correction. Since the end of December, the price has formed a reversible upward structure.
Forecast:
The overall upward trend in price movement will continue throughout the upcoming week. In the first few days, short-term attempts at price reduction are not ruled out but should not go beyond the calculated support. The resistance zone indicates the expected potential for a weekly increase.
Potential Reversal Zones:
Resistance:
Support:
Recommendations:
Sell: Similar deals are risky and can result in losses.
Buy: Short-term deals with a small lot size may be possible after confirmed reversal signals appear. The potential for an upcoming increase should be considered in these deals.
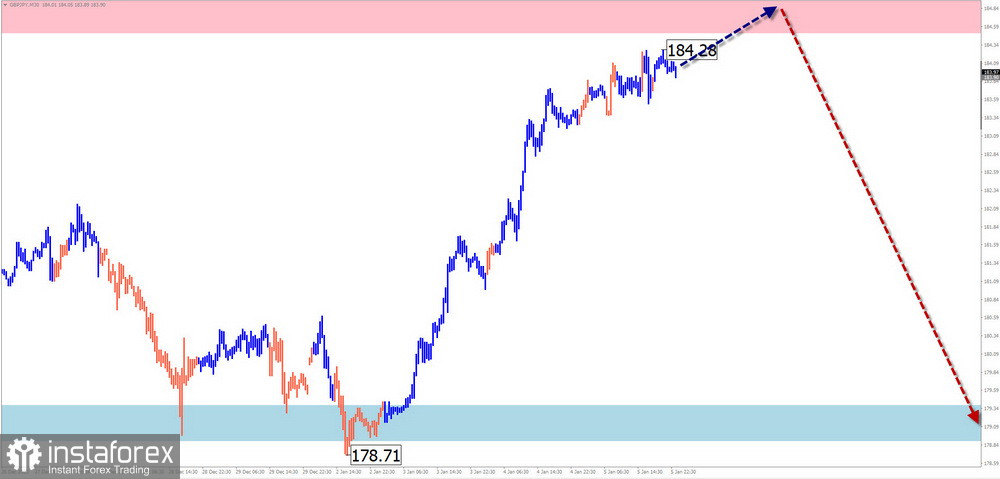
GBP/JPY
Analysis:
On the chart of the cross-pair British pound against the Japanese yen, an upward zigzag has been developing since September 26th. Since mid-July last year, the price has moved sideways, forming the middle part of the wave (B). This movement has entered its final phase. An upward wave with reversal potential has been forming within the sideways movement.
Forecast:
In the coming days, a continuation of the upward price movement is expected, with the price not rising above the potential reversal zone. A strong resistance level passes within its boundaries. In the second half of the upcoming week, a reversal and a resumption of the price decline can be expected with a high probability.
Potential Reversal Zones:
Resistance:
Support:
Recommendations:
Buy: Unpredictable and may lead to losses before the appearance of reversal signals.
Sell: Selling positions can be used after corresponding confirmed reversal signals appear near the calculated support area.
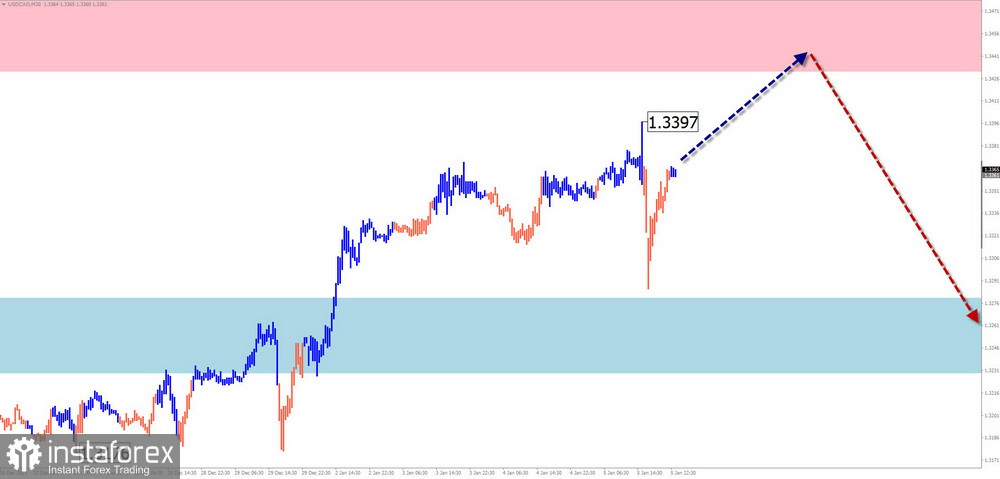
USD/CAD
Analysis:
The Canadian dollar has been moving sideways for the past two months. Within the structure of the upward wave that started on December 27th, a counter-movement is developing that does not exceed the boundaries of the correction (B). This movement still needs to be completed at the time of the analysis.
Forecast:
A gradual movement of quotes towards the calculated resistance area is expected during the upcoming week. Short-term decreases are possible in the next couple of days, even down to the support boundaries.
Potential Reversal Zones:
Resistance:
Support:
Recommendations:
Buy: Can be used with a small lot size within intraday trading.
Sell: Selling positions can be applied with a reduced lot size after confirming reversal signals near the resistance area appear.
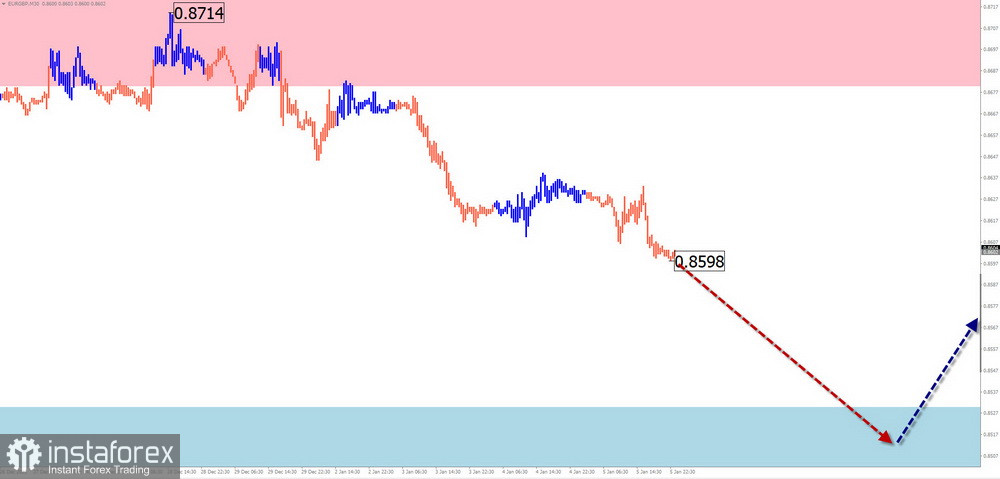
EUR/GBP
Analysis:
In the euro/British pound cross-market, a downward wave that started on September 26th continues to form. The middle part (B) is nearly completed within the wave structure. Quotes are confined in a narrow corridor between strong opposing zones of a larger timeframe. There are no signs of an imminent reversal on the chart.
Forecast:
At the beginning of the upcoming week, a continuation of the downward price trend is expected, with a move toward the support zone possibly leading to a drift sideways and a reversal formation. The beginning of an upward price movement is likely in the week's second half.
Potential Reversal Zones:
Resistance:
Support:
Recommendations:
Buy: Premature before the appearance of reversal signals.
Sell: Selling positions can be used in trading within individual sessions. Reducing the lot size is advisable.
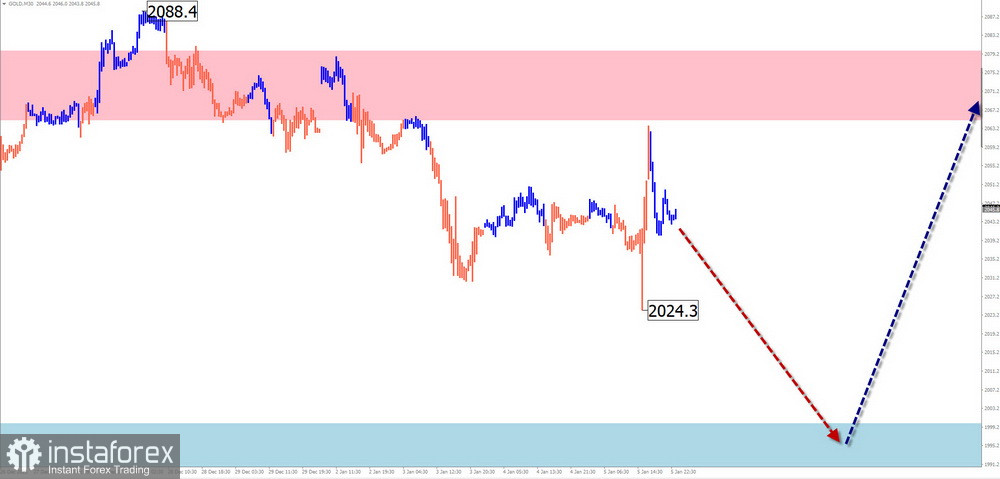
Gold
Analysis:
An algorithm has set short-term trend directions on the gold chart to indicate an upward wave since October last year. Within the structure of the wave from the end of November, a flat correction is developing. The price is moving within a sideways corridor between opposing zones. The corrective structure is missing its final part (C) during analysis.
Forecast:
In the upcoming week, a conclusion of the downward bias is expected, with a decrease in the instrument's price to the support zone. Following this, the price is expected to form a reversal and increase quotes. A change in direction may involve increased volatility and a temporary break below the lower support boundary.
Potential Reversal Zones:
Resistance:
Support:
Recommendations:
Buy: Promising once signals of a change in direction appear.
Sell: Selling positions can be used with a small lot size within individual trading sessions.
Explanations: In simplified wave analysis (SWA), all waves consist of three parts (A-B-C). The analysis focuses on the latest unfinished wave in each timeframe. Dotted lines indicate expected movements.
Attention: Wave analysis does not consider the duration of movements in time!
*The market analysis posted here is meant to increase your awareness, but not to give instructions to make a trade.
InstaSpot analytical reviews will make you fully aware of market trends! Being an InstaSpot client, you are provided with a large number of free services for efficient trading.


