


Our team has over 7,000,000 traders!
Every day we work together to improve trading. We get high results and move forward.
Recognition by millions of traders all over the world is the best appreciation of our work! You made your choice and we will do everything it takes to meet your expectations!
We are a great team together!
InstaSpot. Proud to work for you!


Actor, UFC 6 tournament champion and a true hero!
The man who made himself. The man that goes our way.
The secret behind Taktarov's success is constant movement towards the goal.
Reveal all the sides of your talent!
Discover, try, fail - but never stop!
InstaSpot. Your success story starts here!

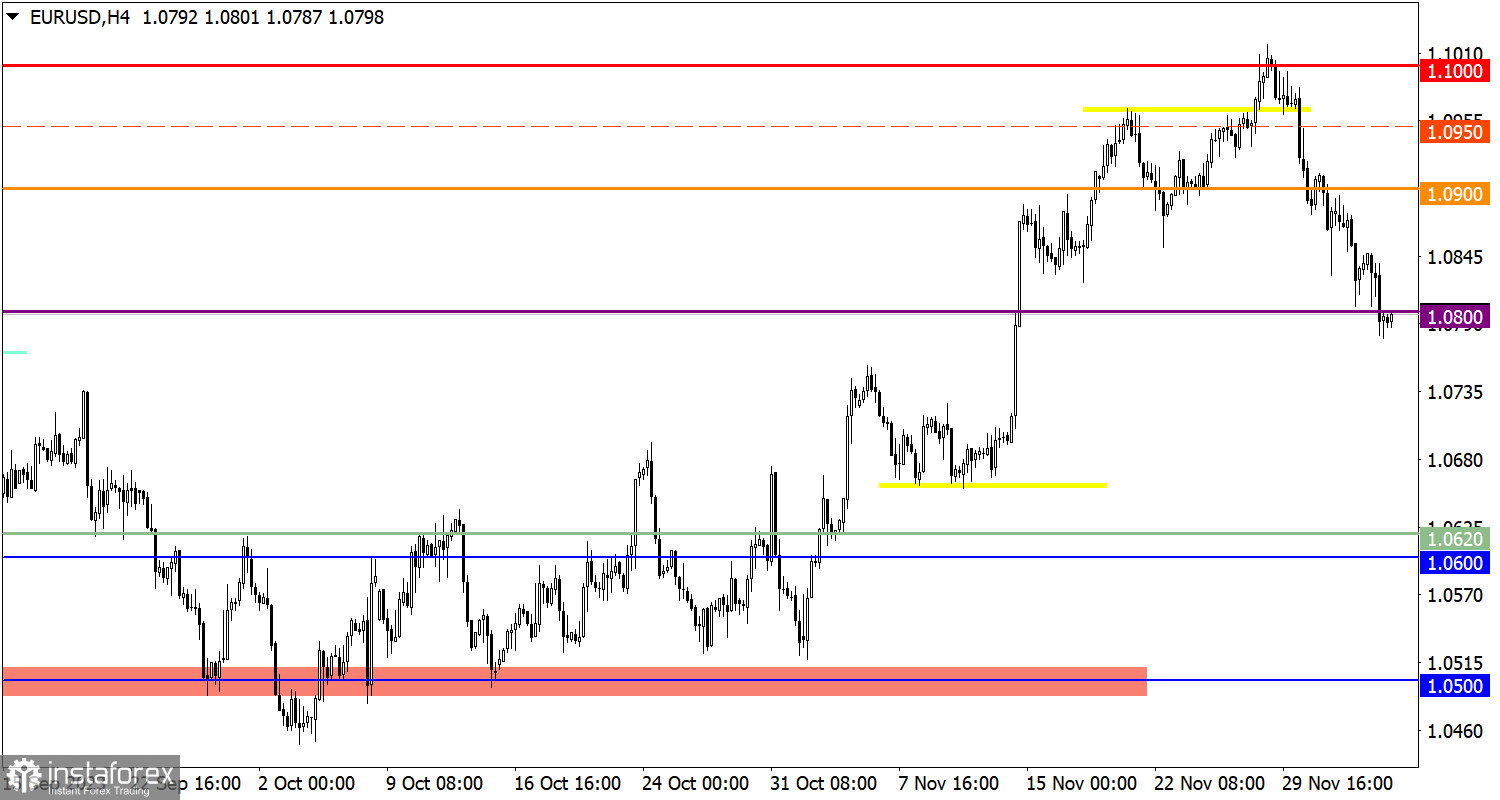
The Producer Price Index in the EU was published, which fell to -9.4% from the previous figure of -12.4%, contrary to analysts' expectations of a decrease to -9.5%.
The EUR/USD currency pair broke through the 1.0800 support level after a brief pullback, indicating further development of a corrective move from the resistance level of 1.1000.
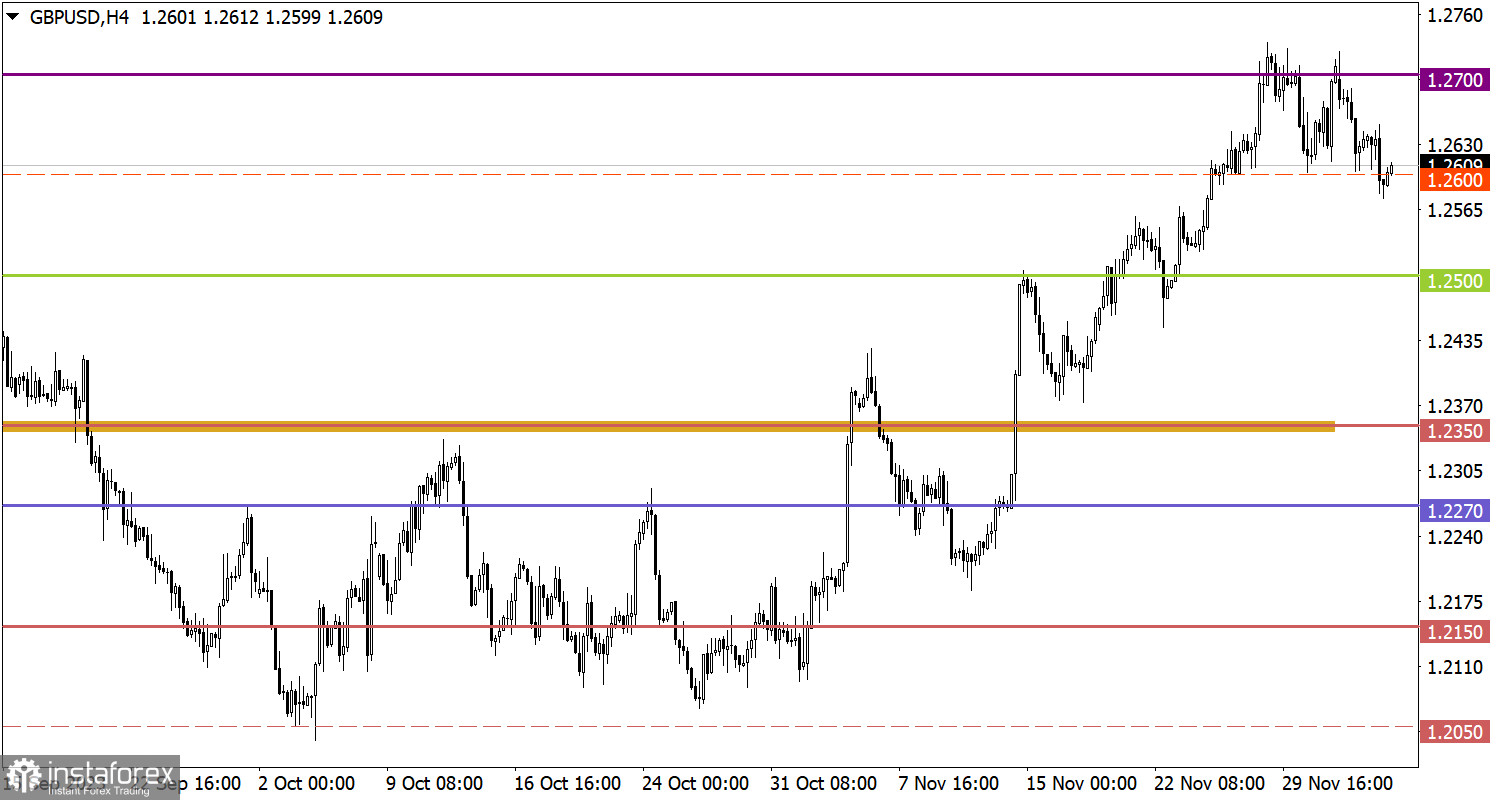
The GBP/USD pair extended the existing market correction. As a result, the quote temporarily fell below the value of 1.2600, indicating an increase in the volume of short positions.

Today, the publication of retail sales data in the EU is expected, where a slowdown in their decline from -2.9% to -0.8% is anticipated.
During the American trading session, equally important statistical data is expected. Traders will undoubtedly be interested in the ADP employment report in the United States, where an increase of 130,000 jobs is forecasted for November.
The ADP report is often considered by traders as a leading indicator of the U.S. Department of Labor's employment report.
Despite the high excitement among traders, a technical signal of oversold conditions is already observed for short positions on the euro in the market. However, a stable price retention below the level of 1.0800 throughout the day, coupled with the momentum-speculative move, may lead to further decline, ignoring the technical signal of the euro being oversold.
Based on the weekly price fluctuation cycle, a characteristic lateral amplitude of 1.2600/1.2700 can be observed, within which the quote moves. In this situation, the optimal tactic is considered to be the outgoing impulse method from the sideways range.
The candlestick chart type is white and black graphic rectangles with lines above and below. With a detailed analysis of each individual candle, you can see its characteristics relative to a particular time frame: opening price, closing price, intraday high and low.
Horizontal levels are price coordinates, relative to which a price may stop or reverse its trajectory. In the market, these levels are called support and resistance.
Circles and rectangles are highlighted examples where the price reversed in history. This color highlighting indicates horizontal lines that may put pressure on the asset's price in the future.
The up/down arrows are landmarks of the possible price direction in the future.
*The market analysis posted here is meant to increase your awareness, but not to give instructions to make a trade.
InstaSpot analytical reviews will make you fully aware of market trends! Being an InstaSpot client, you are provided with a large number of free services for efficient trading.


