


Our team has over 7,000,000 traders!
Every day we work together to improve trading. We get high results and move forward.
Recognition by millions of traders all over the world is the best appreciation of our work! You made your choice and we will do everything it takes to meet your expectations!
We are a great team together!
InstaSpot. Proud to work for you!


Actor, UFC 6 tournament champion and a true hero!
The man who made himself. The man that goes our way.
The secret behind Taktarov's success is constant movement towards the goal.
Reveal all the sides of your talent!
Discover, try, fail - but never stop!
InstaSpot. Your success story starts here!

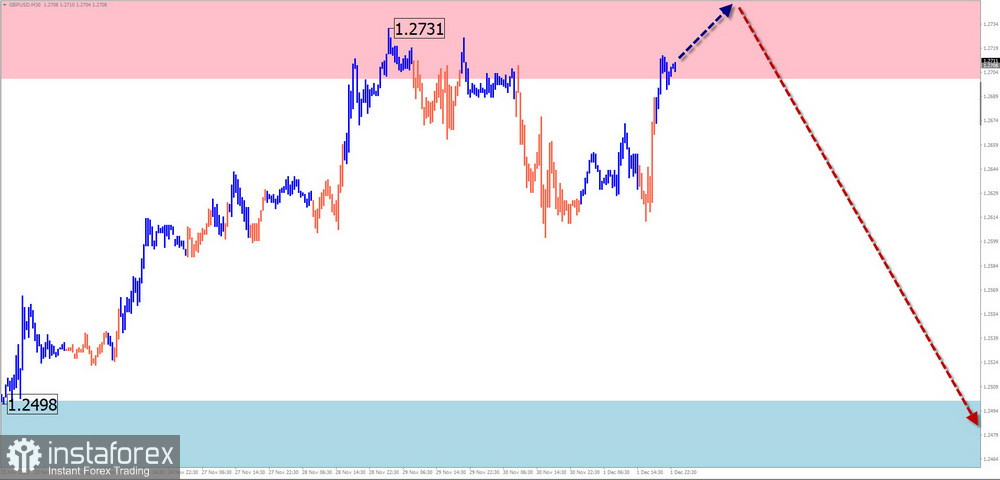
GBP/USD
Brief Analysis:
The ascending wave has defined the major trend of the British pound since the beginning of October. The wave level of the current segment allows classifying its scale as a daily time frame (TF). Quotes are at the lower edge of a wide potential reversal zone. Immediate signals for a change in direction are not observed on the chart.
Week Forecast:
At the beginning of the upcoming week, there is a high probability of a "sideways" movement along the levels of the calculated resistance zone. A short-term breakthrough of its upper boundary is not ruled out. An increase in volatility, a reversal, and the beginning of a downward movement in the pound's price can be expected by the end of the week.
Potential Reversal Zones
Resistance:
Support:
Recommendations
Buying: Lack of potential and may lead to losses.
Selling: After reversal signals in the resistance area appear, they can be used for short-term fractional deals.
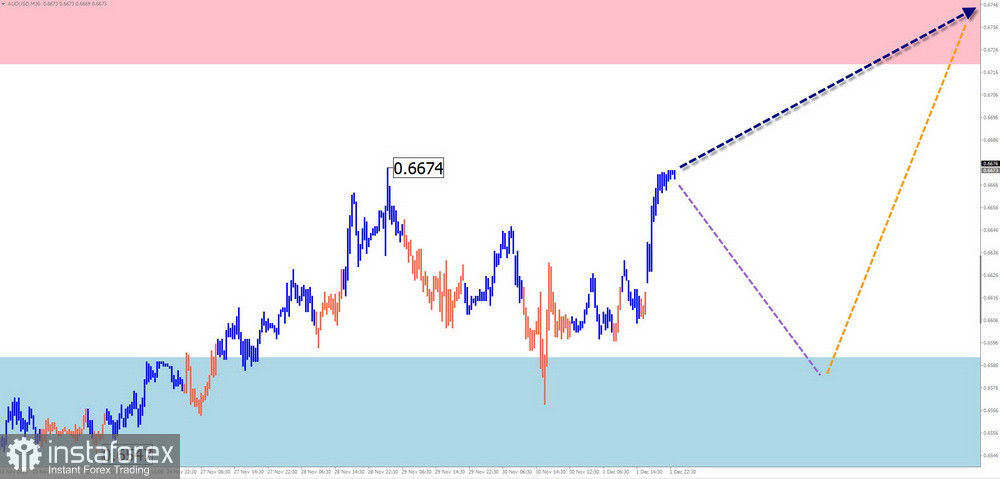
AUD/USD
Brief Analysis:
The weekly chart scale of the main pair of the Australian Dollar indicates the dominance of a descending trend. The ascending segment that started in mid-October forms a correction to the last trending segment. The structure of this movement is not complete at the time of the analysis. The price is approaching the lower boundary of the preliminary target zone.
Week Forecast:
Over the upcoming week, a gradual movement of the pair's quotes towards the calculated resistance zone is expected. The nature of oscillations is expected to be flat. A short-term decrease beyond the support zone is included in the next few days. An active growth phase is closer to the weekend.
Potential Reversal Zones
Resistance:
Support:
Recommendations
Selling: Premature until the current wave is completed.
Buying: This can be recommended with a reduced lot from the support zone after corresponding signals from your trading system (TS) appear. The resistance zone limits the potential.
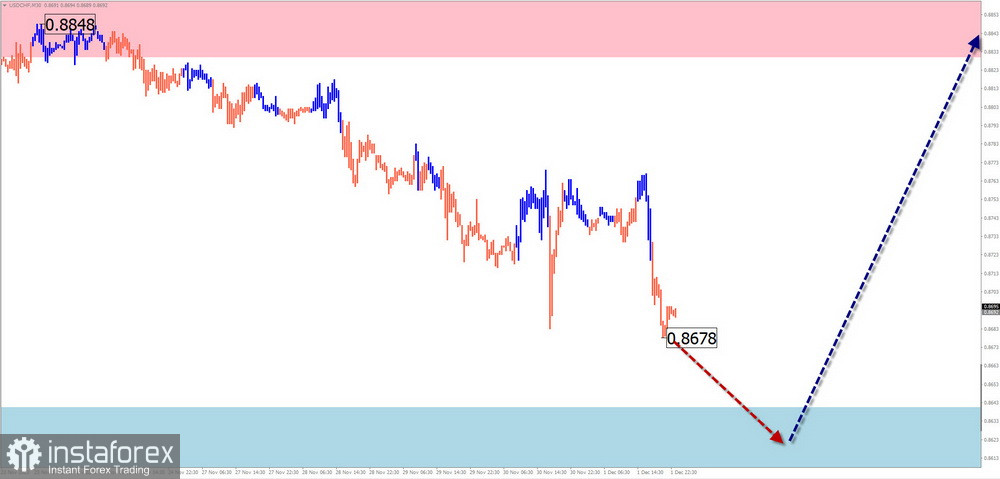
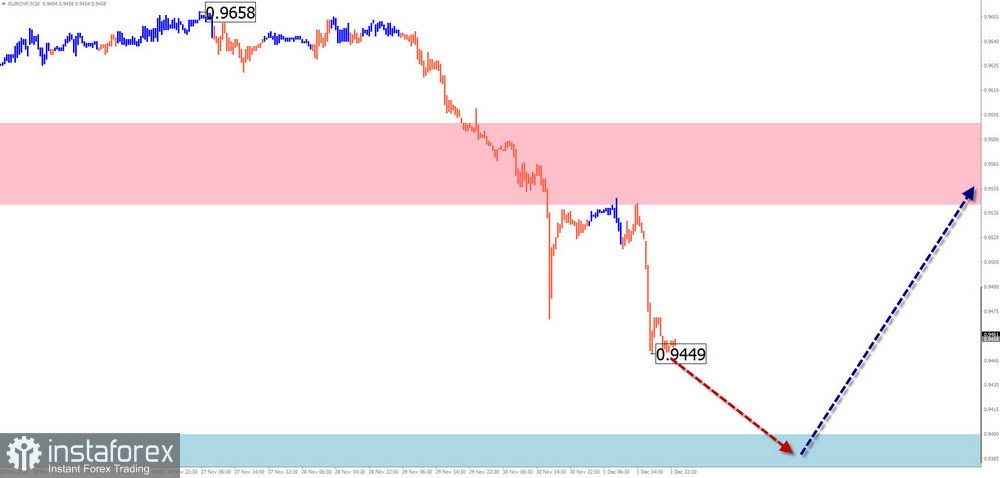
USD/CHF
Brief Analysis:
Today's unfinished wave structure resembles a flat plane and has been reported since mid-July. The structure of the wave develops in the middle part (B). This segment looks complete, but signals of an imminent change in direction are not observed on the chart.
Week Forecast:
A reversal and the beginning of a price rise can be expected after the likely pressure on the support zone on the pair's chart. The price increase is possible up to the calculated resistance. Its boundary passes along the upper edge of the preliminary target zone of the entire current wave.
Potential Reversal Zones
Resistance:
Support:
Recommendations
Selling: No conditions for such deals in the coming days.
Buying: After corresponding signals from your TS appear, they can be used for trading deals. The nearest support limits the potential.
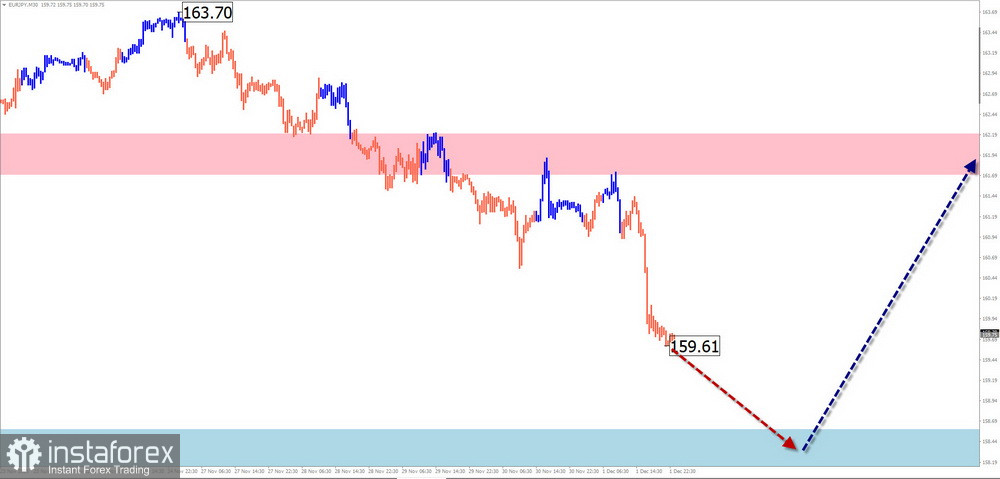
EUR/JPY
Brief Analysis:
Today's unfinished wave structure of the Euro/Yen chart is ascending, starting from July 28th. The descending correction that started in mid-November exceeded the rollback level of the last segment and continued its development. Quotes are approaching the upper boundary of a powerful potential reversal zone. Signals of an imminent change in direction are not observed.
Week Forecast:
In the next few days, a gradual decrease in the cross's price is expected up to the boundaries of the calculated support. After that, the formation of a reversal and the resumption of the bullish mood of the movement can be expected. The highest activity is likely closer to the weekend.
Potential Reversal Zones
Resistance:
Support:
Recommendations
Buying: Premature until the current wave is complete.
Selling: Can be used with a fractional lot within individual sessions. It is recommended to close deals at the first signs of a reversal.
EUR/CHF
Brief Analysis:
The short-term trend of the Euro/Swiss Franc cross since January of this year is directed downward. As of today, the latest trending segment reports, which are still unfinished, date back to November 20th. Its structure at the time of the analysis does not show completeness.
Week Forecast:
In the next couple of days, the price will continue to move down to the contact with the support zone. Further, the formation of a reversal and the beginning of a bullish mood of the cross can be expected. The resistance zone demonstrates the upper boundary of the maximum possible weekly movement of the pair.
Potential Reversal Zones
Resistance:
Support:
Recommendations
Buying: This will become relevant for trading after the appearance of reversal signals on your TS.
Selling: Possible with a fractional lot within individual sessions. They have limited potential.
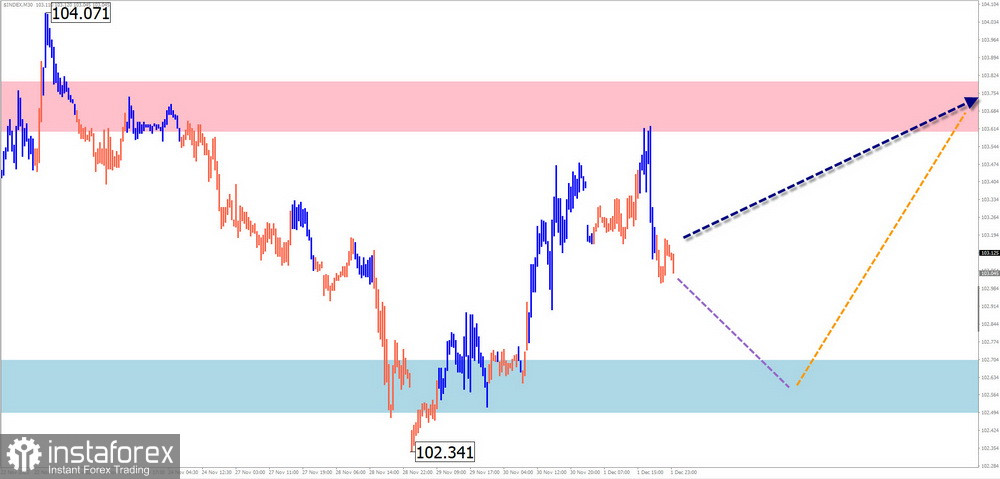
US dollar index
Brief Analysis:
The daily scale of the US dollar index demonstrates a descending wave from October 3rd, which still needs to be completed. In the last decade, index quotes on the chart form an elongated horizontal plane.
Week Forecast:
A slight decrease in the US Dollar rate against other world currencies can be expected in the upcoming week. The trend is temporary since the calculated support limits the downward movement range. Further, an increase in dollar values is expected, not exceeding the resistance.
Potential Reversal Zones
Resistance:
Support:
Recommendations
There are no conditions for selling national currencies in the upcoming week. In the next couple of days, transactions on the
strengthening of other currencies against the US dollar may be profitable.
Notes: In simplified wave analysis (SWA), all waves consist of 3 parts (A-B-C). The analysis focuses on the last unfinished wave on each TF. Dashed lines indicate expected movements.
Attention: The wave algorithm does not consider the duration of instrument movements in time!
*The market analysis posted here is meant to increase your awareness, but not to give instructions to make a trade.
InstaSpot analytical reviews will make you fully aware of market trends! Being an InstaSpot client, you are provided with a large number of free services for efficient trading.


