


Our team has over 7,000,000 traders!
Every day we work together to improve trading. We get high results and move forward.
Recognition by millions of traders all over the world is the best appreciation of our work! You made your choice and we will do everything it takes to meet your expectations!
We are a great team together!
InstaSpot. Proud to work for you!


Actor, UFC 6 tournament champion and a true hero!
The man who made himself. The man that goes our way.
The secret behind Taktarov's success is constant movement towards the goal.
Reveal all the sides of your talent!
Discover, try, fail - but never stop!
InstaSpot. Your success story starts here!

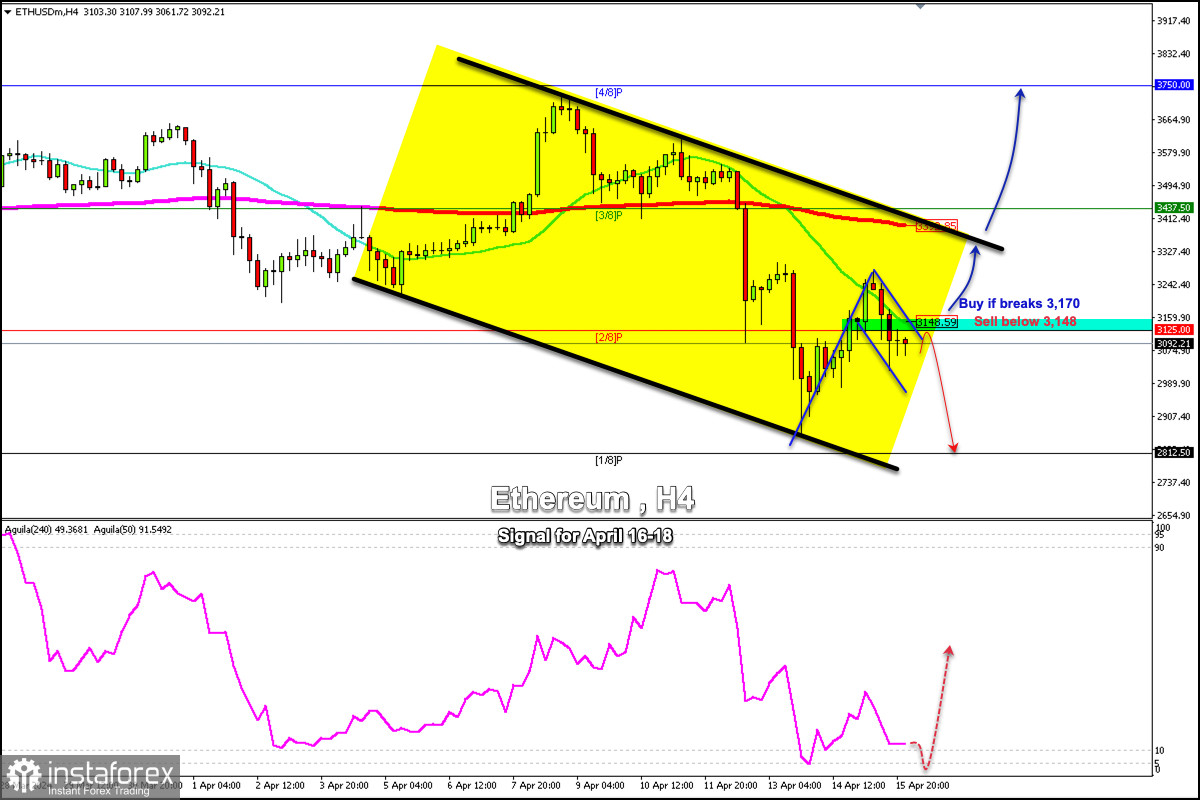
ETH/USD is trading around 3,092.21 forming a bullish flag pattern on the H4 chart. If Ether breaks sharply above 3,150, the signal for this pattern could be confirmed and we could expect it to reach the top of the downtrend channel around 3,360.
In case Ethereum fails to break and confirm the flag pattern signal, we could expect the decline to continue and ETH could reach 1/8 Murray located at 2,812. Below this area, it could reach the psychological level of 2,500.
We believe that Ether could have a bullish rally in the coming days since conditions are preparing for a bullish impulse so that the token could reach 4/8 Murray around 3,750.
A sharp break above the downtrend channel forming since early April as well as a consolidation above 3,380 and above the 200 EMA could confirm the bullish move. Therefore, we could expect ETH to reach 3,579 which represents the April 7 high and finally, 3,750.
The eagle indicator is approaching the oversold zone. It means that ETH/USD is likely to see a bullish rally in the coming days and we could look for opportunities to buy only if the price consolidates above the psychological level of $3,000.
*The market analysis posted here is meant to increase your awareness, but not to give instructions to make a trade.
InstaSpot analytical reviews will make you fully aware of market trends! Being an InstaSpot client, you are provided with a large number of free services for efficient trading.


