


Our team has over 7,000,000 traders!
Every day we work together to improve trading. We get high results and move forward.
Recognition by millions of traders all over the world is the best appreciation of our work! You made your choice and we will do everything it takes to meet your expectations!
We are a great team together!
InstaSpot. Proud to work for you!


Actor, UFC 6 tournament champion and a true hero!
The man who made himself. The man that goes our way.
The secret behind Taktarov's success is constant movement towards the goal.
Reveal all the sides of your talent!
Discover, try, fail - but never stop!
InstaSpot. Your success story starts here!


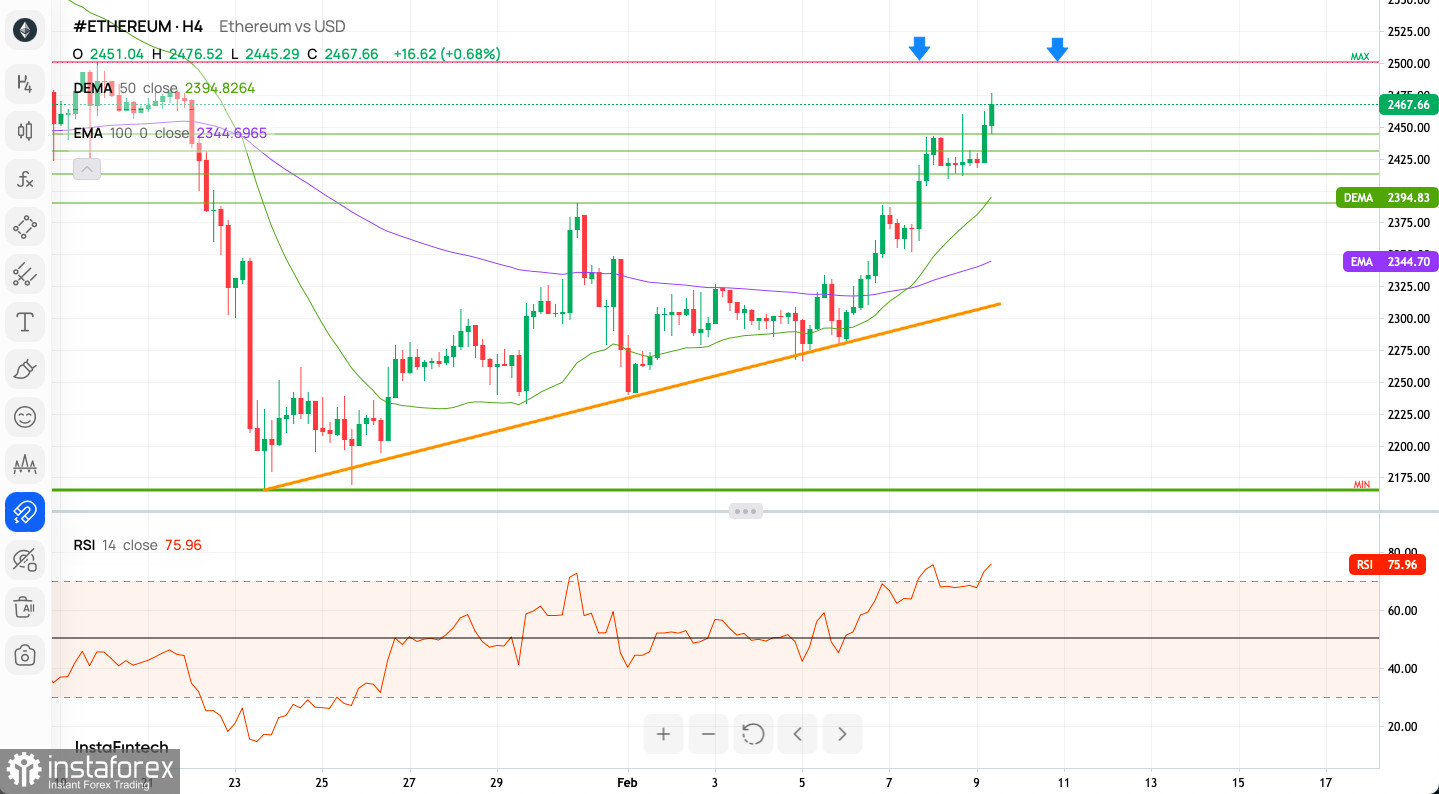
Ethereum (ETH/USD) surged to $2,465, breaching the supply zone post Double Top pattern invalidation on the H4 chart. $2,390 and $2,445 now serve as critical support levels, with strong H4 momentum favoring short-term bulls, albeit amidst extreme overbought conditions.
Resistance Levels:
Blue arrow-marked levels highlight resistance targets, notably below $2,500, potentially acting as a psychological barrier.
Intraday 1H Indicator Signals:
Sentiment Scoreboard: Bullish sentiment dominates at 74%, with a recent uptick indicating continued optimism.
Weekly Pivot Points:
Identify potential reversals, support, and resistance:
Conclusion:
ETH/USD presents bullish indicators, yet caution is warranted due to overbought RSI levels. Traders should monitor RSI corrections and resistance levels to assess trend strength. Risk management and market news awareness remain crucial.
The begginers in forex trading need to be very careful when making decisions about entering the market. Before the release of important reports, it is best to stay out of the market to avoid being caught in sharp market fluctuations due to increased volatility. If you decide to trade during the news release, then always place stop orders to minimize losses.
Without placing stop orders, you can very quickly lose your entire deposit, especially if you do not use money management and trade large volumes. For successful trading, you need to have a clear trading plan and stay focues and disciplined. Spontaneous trading decision based on the current market situation is an inherently losing strategy for a scalper or daytrader.
*The market analysis posted here is meant to increase your awareness, but not to give instructions to make a trade.
InstaSpot analytical reviews will make you fully aware of market trends! Being an InstaSpot client, you are provided with a large number of free services for efficient trading.


