


Our team has over 7,000,000 traders!
Every day we work together to improve trading. We get high results and move forward.
Recognition by millions of traders all over the world is the best appreciation of our work! You made your choice and we will do everything it takes to meet your expectations!
We are a great team together!
InstaSpot. Proud to work for you!


Actor, UFC 6 tournament champion and a true hero!
The man who made himself. The man that goes our way.
The secret behind Taktarov's success is constant movement towards the goal.
Reveal all the sides of your talent!
Discover, try, fail - but never stop!
InstaSpot. Your success story starts here!

In July, consumer prices in the United States increased by 3.2% anually. This inflationary growth was higher than the 3% in June, which was the lowest since March 2021. Nevertheless, it was expected that inflation would accelerate to 3.3%.
Core inflation in the U.S., excluding food and energy prices, slowed to 4.7% year-on-year from 4.8% in June. On a monthly basis, it was 0.2%, the same as in June.
This slight discrepancy in expectations had a positive impact on financial markets. Experts, on the whole, predict that the Federal Reserve will likely pause its interest rate hike cycle in light of the latest data.
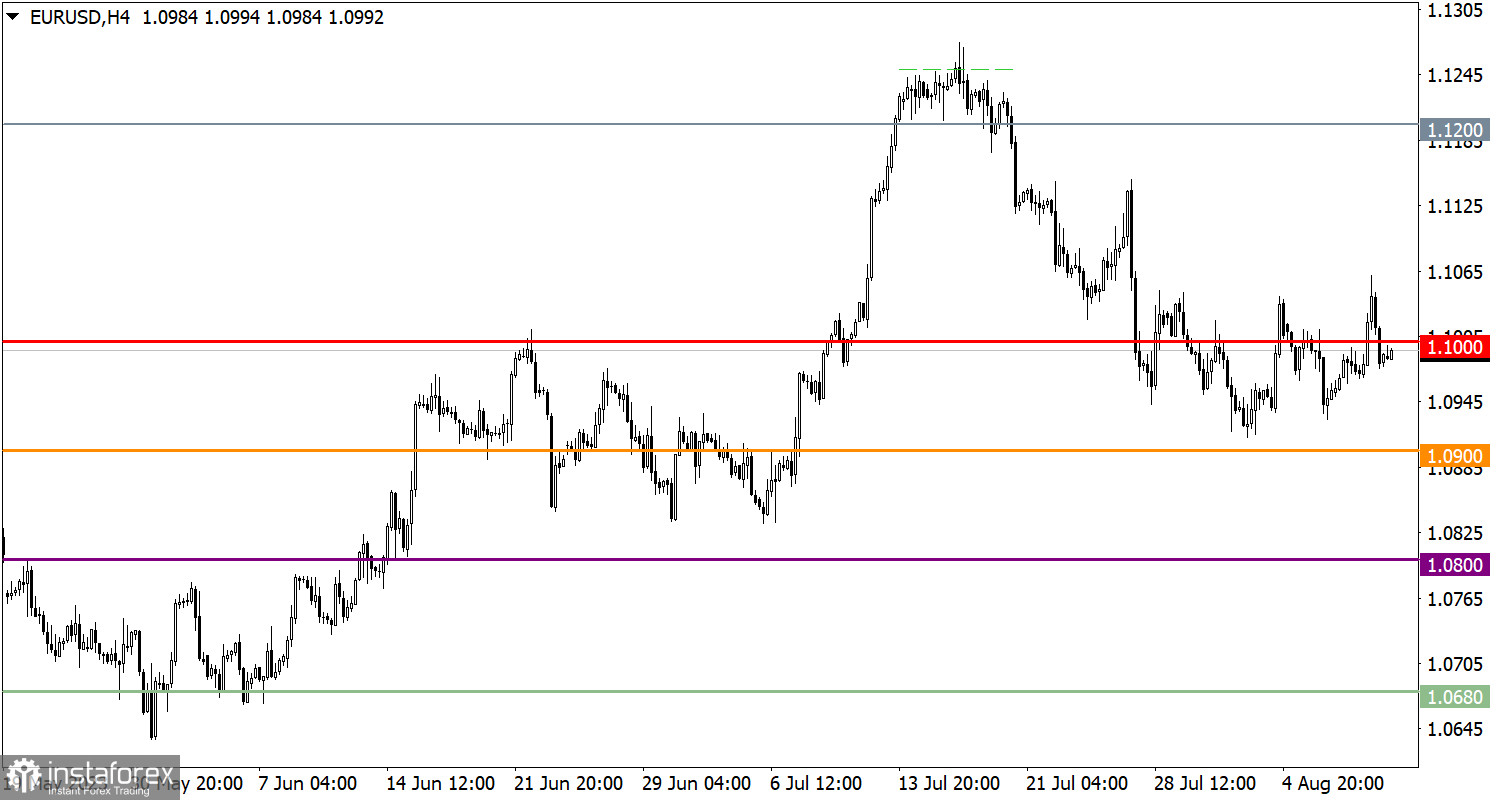
Influenced by news events, the Euro to U.S. dollar exchange rate momentarily deviated from its current range in the market. As a result of this deviation, the Euro quote briefly rose above the 1.1060 level. However, buyers couldn't maintain the price at this level, and there was a pullback, which led to a decrease in the quote below the 1.1000 mark.
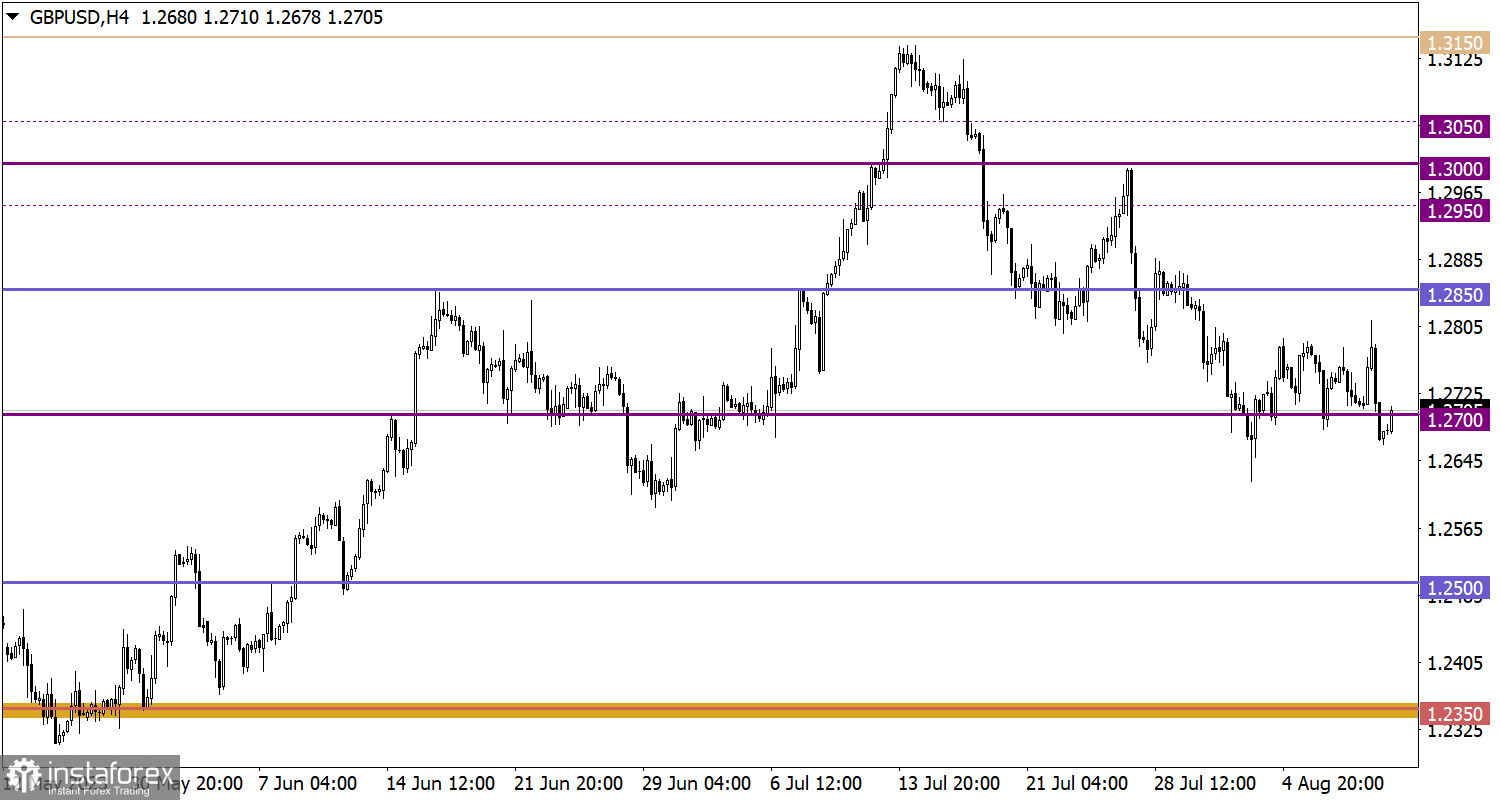
The GBP/USD currency pair showed high volatility: the quote first jumped above the 1.2800 mark, then dropped below the 1.2700 level. This bidirectional interest points to speculative activity in the market, which might be associated with recent sharp price changes.
The unexpected growth of the UK's GDP by 0.2% in the second quarter compared to the previous three months came as a surprise to analysts who expected a zero change in the indicator. This coincided with the release of data on industrial production in the country, which reached its highest level in three years. In June 2023, industrial production grew by 1.8% compared to the previous month, recovering after a decrease of 0.6% in the previous month. This significant growth in industrial activity exceeded market expectations by 0.1% and was the best since August 2020.
These positive statistical data supported the British currency.
During the American trading session, the release of producer price data in the United States is expected, and most likely, the growth rate of these prices will accelerate from 0.1% to 0.7%. This could contribute to the continued rise in inflation. Such a turn of events might lead the Federal Reserve to eventually continue raising the interest rate. Such expectations could positively influence the value of the dollar.
If the price continues to hold below the 1.0900 level, traders will consider the possibility of a bearish scenario, which might lead to a continuation of the corrective cycle.
On the other hand, if the price remains firmly above the 1.1050 level, then a bullish scenario becomes relevant. In this case, the market might begin a phased process of restoring the euro rate, which, over time, could indicate the end of the current corrective movement.
A stable price hold below the 1.2700 level increases the likelihood of further decline, which, according to technical analysis, might lead to the continuation of the corrective cycle. However, for the realization of an alternative scenario related to the potential increase in the volume of long positions in the pound sterling, the quote first needs to return above the 1.2700 level during the daily period. A clear signal of a potential end to the corrective cycle will only be observed after a stable hold of the price above the 1.2800 value.
The candlestick chart type is white and black graphic rectangles with lines above and below. With a detailed analysis of each individual candle, you can see its characteristics relative to a particular time frame: opening price, closing price, intraday high and low.
Horizontal levels are price coordinates, relative to which a price may stop or reverse its trajectory. In the market, these levels are called support and resistance.
Circles and rectangles are highlighted examples where the price reversed in history. This color highlighting indicates horizontal lines that may put pressure on the asset's price in the future.
The up/down arrows are landmarks of the possible price direction in the future.
*The market analysis posted here is meant to increase your awareness, but not to give instructions to make a trade.
InstaSpot analytical reviews will make you fully aware of market trends! Being an InstaSpot client, you are provided with a large number of free services for efficient trading.


