


Our team has over 7,000,000 traders!
Every day we work together to improve trading. We get high results and move forward.
Recognition by millions of traders all over the world is the best appreciation of our work! You made your choice and we will do everything it takes to meet your expectations!
We are a great team together!
InstaSpot. Proud to work for you!


Actor, UFC 6 tournament champion and a true hero!
The man who made himself. The man that goes our way.
The secret behind Taktarov's success is constant movement towards the goal.
Reveal all the sides of your talent!
Discover, try, fail - but never stop!
InstaSpot. Your success story starts here!

Key Takeaways:
Understanding Market Movements: A Technical Analysis of BTC/USD

Subtle Shifts in Market Dynamics The recent news regarding the postponement of Bitcoin ETFs to Q2 2024 has sent ripples through the cryptocurrency market. This development coincided with Bitcoin's 15th anniversary, leading to a significant price drop from over $45,000 to $41,800. The market's reaction underscores its sensitivity to regulatory shifts and expectations.
Technical Indicators: A Closer Look The BTC/USD pair experienced a sharp sell-off following the Matrixport report, testing the 2023 high and a key support level before declining over 11%. This indicates a sudden shift in market sentiment.
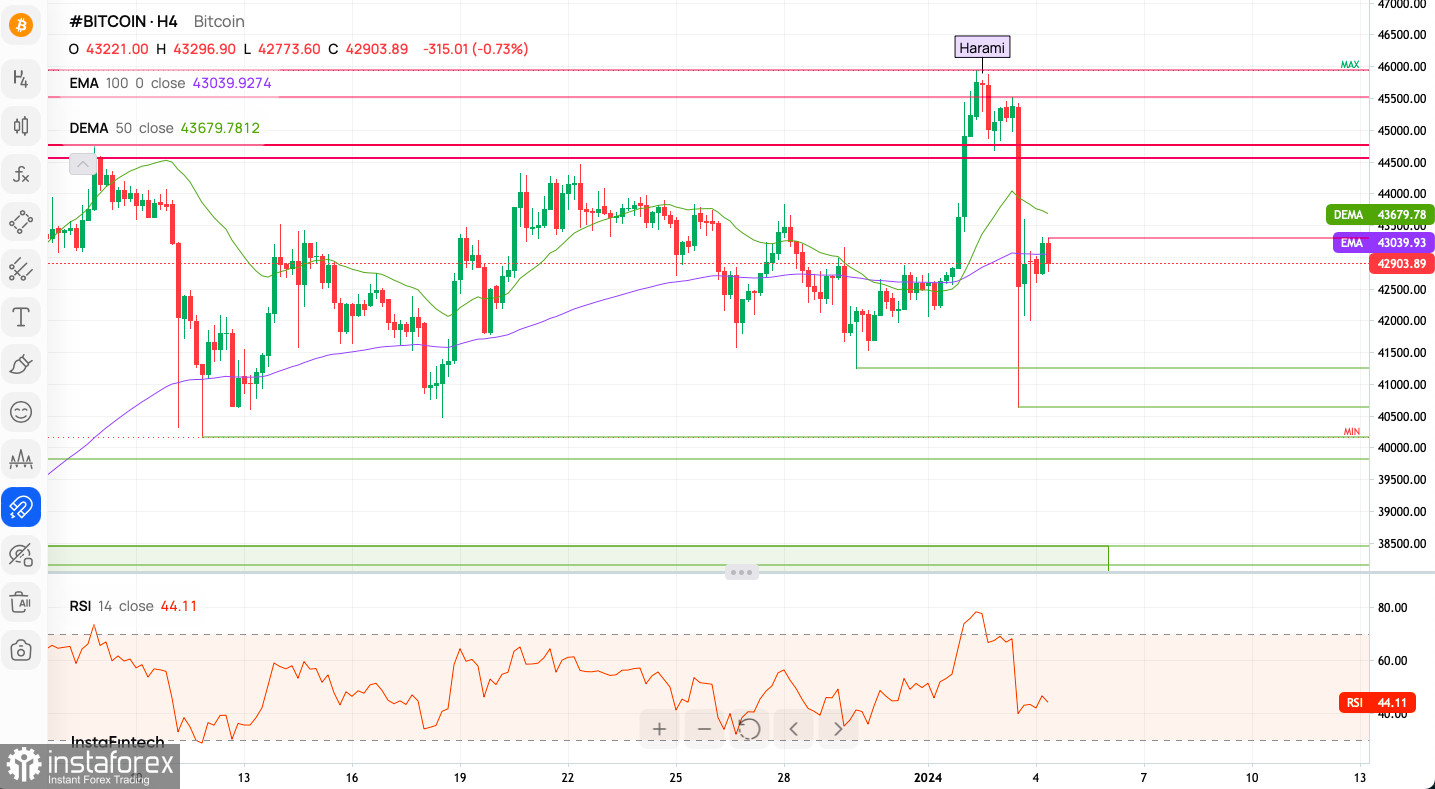
Intraday Analysis: Selling Pressure Intensifies The intraday technical indicators reveal a dominant selling trend, with the majority signaling 'Sell'. This is supported by the moving averages, all of which are indicating a selling trend as well.
Market Sentiment: Bullish vs. Bearish Interestingly, despite the bearish technical indicators, the general market sentiment remains predominantly bullish. This dichotomy between technical signals and market sentiment could indicate a potential mismatch between short-term trader actions and long-term investor beliefs.
Pivotal Points: Weekly Analysis Weekly pivot points serve as key markers for potential trend reversals and support/resistance levels. The current levels range from $38,079 to $51,335, providing a broad spectrum for potential market movements.
Long-Term Outlook: Bullish Trend Continues On a weekly timeframe, the analysis remains bullish. The Adaptive Moving Averages and Elliott Wave Theory suggest an ongoing strong bullish trend. The Elliott Wave Oscillator aligns with this, indicating positive momentum.
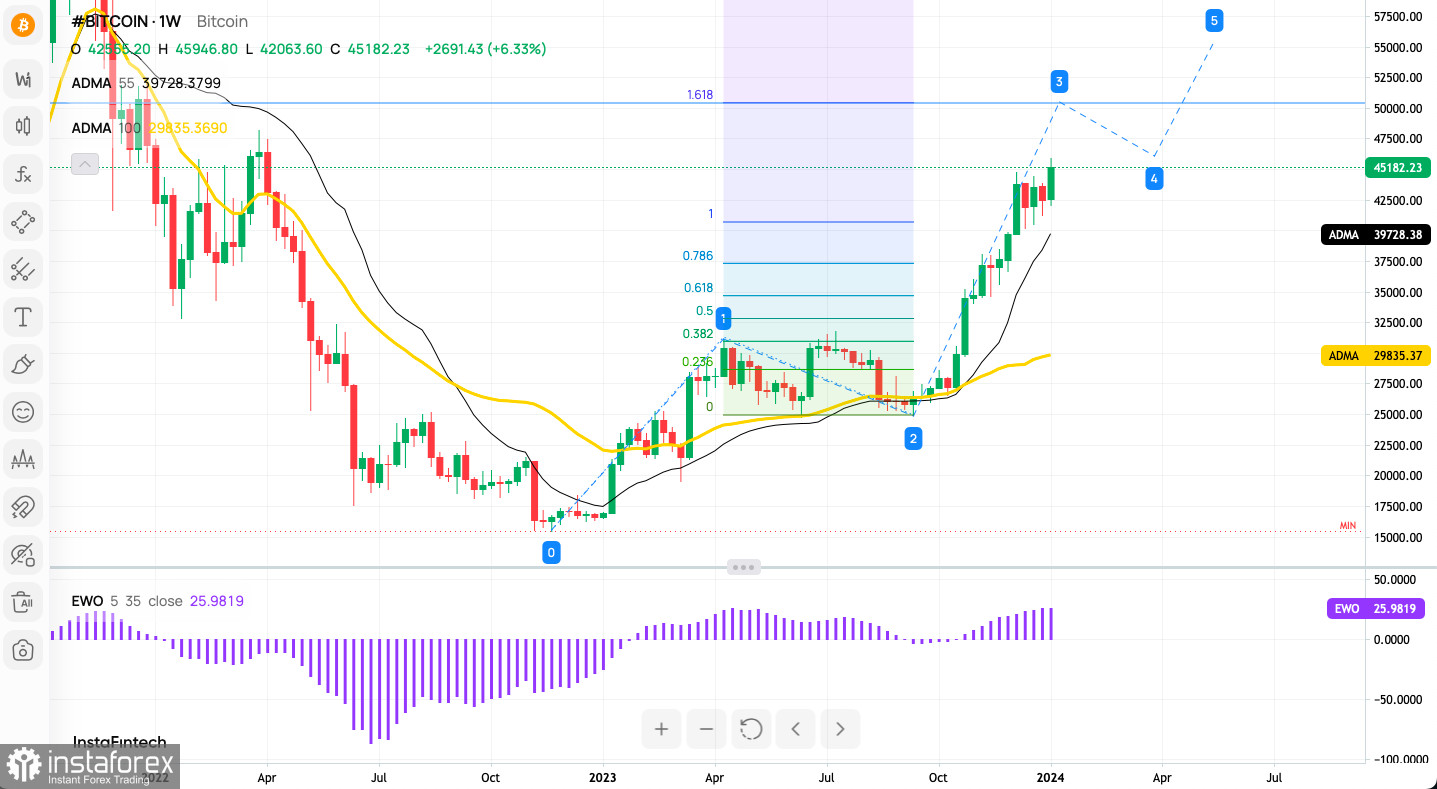
Conclusion: Practical Trading Insights For bullish traders, the key is monitoring the $48,200 level as the next long-term target, maintaining a watchful eye on the $19,572 level to avoid a trend reversal. For bears, the focus should be on the $32,829 and $31,790 support levels, which if broken, could signal a more significant downturn.
The begginers in forex trading need to be very careful when making decisions about entering the market. Before the release of important reports, it is best to stay out of the market to avoid being caught in sharp market fluctuations due to increased volatility. If you decide to trade during the news release, then always place stop orders to minimize losses.
Without placing stop orders, you can very quickly lose your entire deposit, especially if you do not use money management and trade large volumes. For successful trading, you need to have a clear trading plan and stay focues and disciplined. Spontaneous trading decision based on the current market situation is an inherently losing strategy for a scalper or daytrader.
*The market analysis posted here is meant to increase your awareness, but not to give instructions to make a trade.
InstaSpot analytical reviews will make you fully aware of market trends! Being an InstaSpot client, you are provided with a large number of free services for efficient trading.


