


The legend in the InstaSpot team!
Legend! You think that's bombastic rhetoric? But how should we call a man, who became the first Asian to win the junior world chess championship at 18 and who became the first Indian Grandmaster at 19? That was the start of a hard path to the World Champion title for Viswanathan Anand, the man who became a part of history of chess forever. Now one more legend in the InstaSpot team!


Borussia is one of the most titled football clubs in Germany, which has repeatedly proved to fans: the spirit of competition and leadership will certainly lead to success. Trade in the same way that sports professionals play the game: confidently and actively. Keep a "pass" from Borussia FC and be in the lead with InstaSpot!

Trend analysis
GBP/USD may resume its upward movement this week, starting from the level of 1.2834 (closing of the last weekly candle) to the upper border of the Bollinger lines indicator at 1.2933 (black dotted line). Upon reaching this price, the pair may continue rising towards the upper fractal at 1.3005 (red dotted line).
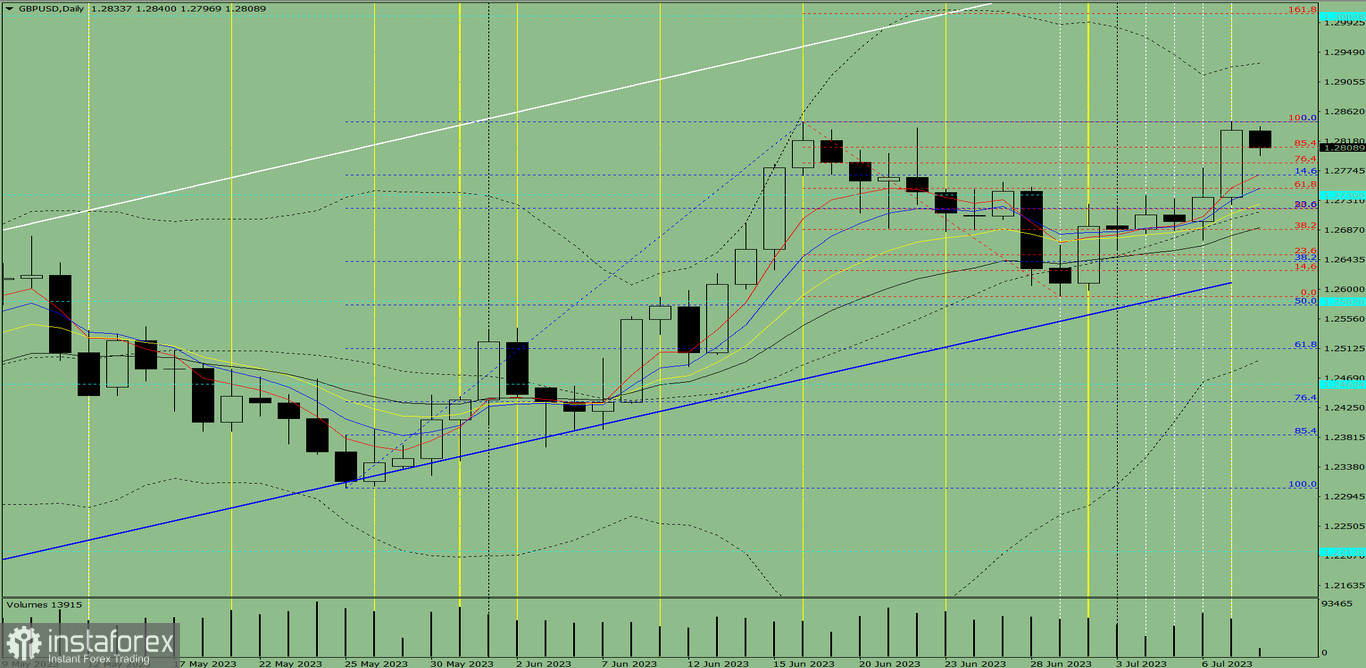
Fig. 1 (weekly chart)
Comprehensive analysis:
Indicator analysis - upward
Fibonacci levels - upward
Volumes - upward
Candlestick analysis - upward
Trend analysis - upward
Bollinger bands - upward
Monthly chart - upward
Conclusion: All indicators point to an upward movement in GBP/USD.
Overall conclusion: The pair will have a bullish trend, with a first lower shadow on the weekly white candle (Monday - upward) and no second upper shadow (Friday - upward).
So during the week, pound will rise from 1.2834 (closing of the last weekly candle) to the upper border of the Bollinger lines indicator at 1.2933 (black dotted line), and then continue towards the upper fractal at 1.3005 (red dotted line).
Alternatively, the quote may move up from 1.2834 (closing of the last weekly candle) to the upper border of the Bollinger lines indicator at 1.2933 (black dotted line), followed by a decline.
*The market analysis posted here is meant to increase your awareness, but not to give instructions to make a trade.
InstaSpot analytical reviews will make you fully aware of market trends! Being an InstaSpot client, you are provided with a large number of free services for efficient trading.


