


Our team has over 7,000,000 traders!
Every day we work together to improve trading. We get high results and move forward.
Recognition by millions of traders all over the world is the best appreciation of our work! You made your choice and we will do everything it takes to meet your expectations!
We are a great team together!
InstaSpot. Proud to work for you!


Actor, UFC 6 tournament champion and a true hero!
The man who made himself. The man that goes our way.
The secret behind Taktarov's success is constant movement towards the goal.
Reveal all the sides of your talent!
Discover, try, fail - but never stop!
InstaSpot. Your success story starts here!

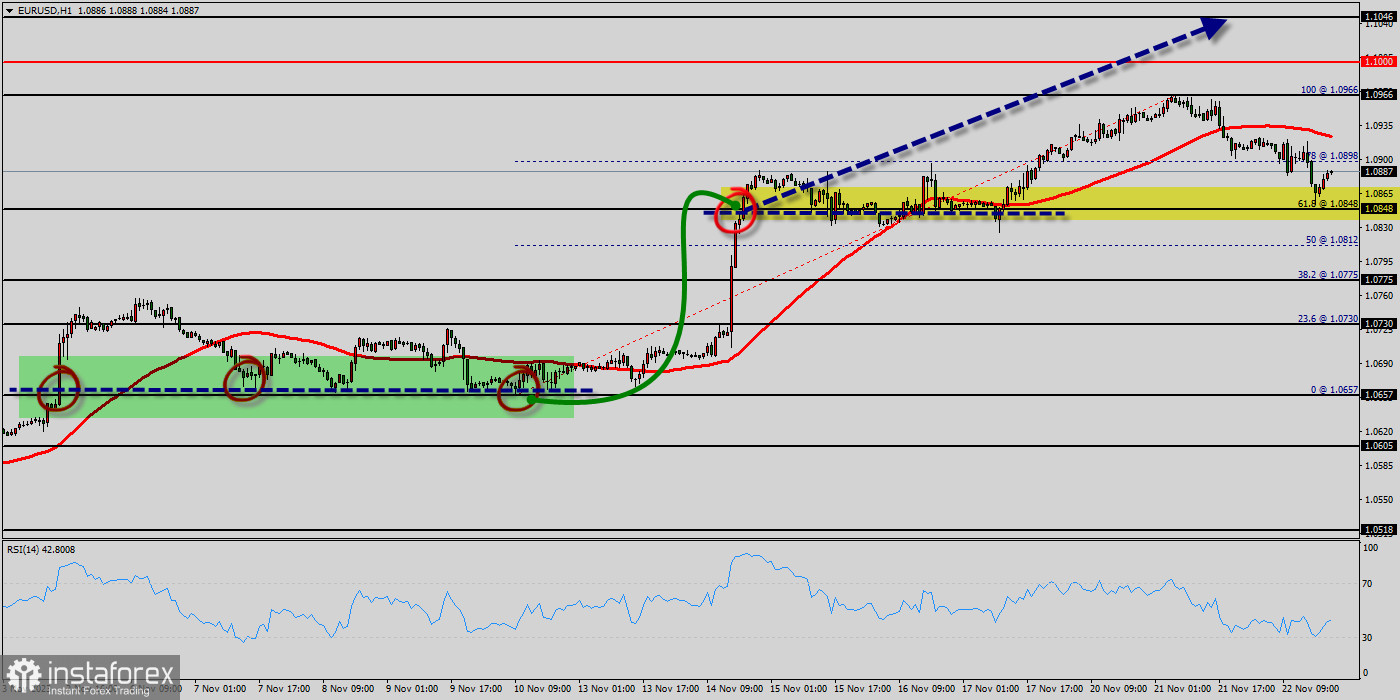
The EUR/USD pair continues to move upwards from the level of 1.0848. Today, the first support level is currently seen at 1.0848, the price is moving in a bullish channel now. Furthermore, the price has been set above the strong support at the level of 1.0848, which coincides with the 61.8% Fibonacci retracement level.
This support has been rejected three times confirming the veracity of an uptrend. According to the previous events, we expect the EUR/USD pair to trade between 1.0848 and 1.0966. It should be noted that volatility is very high for that the EUR/USD pair is still moving between 1.0848 and 1.0966 in coming hours.
This is confirmed by the RSI indicator signaling that we are still in the bullish trending market. Now, the pair is likely to begin an ascending movement to the point of 1.0900 and further to the level of 1.0966.
So, the support stands at 1.0848, while daily resistance is found at 1.0966. Therefore, the market is likely to show signs of a bullish trend around the spot of 1.0848.
In other words, buy orders are recommended above the spot of 1.0848 with the first target at the level of 1.0900; and continue towards 1.0966.
However, if the EUR/USD pair fails to break through the resistance level of 1.0966 today, the market will decline further to 1.0503.
New outlook :
For next weeks : The EUR/USD pair steadies near 1.0571 after USD slide. The EUR/USD pair reached a peak of 1.0571 following the release of a weak ISM Services PMI report from the US. The EUR/USD pair is currently hovering near the 1.0571 level, unchanged for the day.
The EUR/USD pair trades with modest losses, not far above the two-week low posted last week at 1.0636. Technical readings in the daily chart favor a downward extension as a bearish 50 Simple Moving Average (SMA) heads south below a flat 100 SMA, both above the current level.
Also, the pair remains above a critical static support level, the 23.6% Fibonacci retracement of the 2023 yearly slump at 1.0682. Finally, technical indicators remain within positive levels, with neutral-to-bullish slopes. The EUR/USD pair broke resistance which turned to strong support at the level of 1.0682.
The level of 1.0682 coincides with 23.6% of Fibonacci, which is expected to act as major support today. Since the trend is above the 23.6% Fibonacci level, the market is still in an uptrend. From this point, the EUR/USD pair is continuing in a bullish trend from the new support of 1.0682. Currently, the price is in a bullish channel.
According to the previous events, we expect the EUR/USD pair to move between 1.0682 and 1.0789. On the H1 chart, resistance is seen at the levels of 1.0757 and 1.0789. Also, it should be noticed that, the level of 1.0734 represents the daily pivot point.
Therefore, strong support will be formed at the level of 1.0682 providing a clear signal to buy with the targets seen at 1.0734. If the trend breaks the support at 1.0734 (first resistance) the pair will move upwards continuing the development of the bullish trend to the level 1.0789 in order to test the daily resistance 2.
However, stop loss is to be placed below the level of 1.0636 - last bearish wave. The EUR/USD pair continues to move upwards from the level of 1.0687. The pair rose from the level of 1.0687 (the level of 1.0687 coincides with a ratio of 0% Fibonacci retracement - last bearish wave) to a top around 1.0754.
Today, the first support level is seen at 1.0687 followed by 1.0600, while daily resistance 1 is seen at 1.0785. According to the previous events, the EUR/USD pair is still moving between the levels of 1.0687 and 1.0785; for that we expect a range of 98pips (1.0785 - 1.0687). On the one-hour chart, immediate resistance is seen at 1.0785, which coincides with a ratio of 50% Fibonacci retracement - the first bullish wave.
Currently, the price is moving in a bullish channel. This is confirmed by the RSI indicator signaling that we are still in a bullish trending market. The price is still above the moving average (100) and (50). Therefore, if the trend is able to break out through the first resistance level of 1.0785, we should see the pair climbing towards the daily resistance at 1.0808 to test it.
It would also be wise to consider where to place stop loss; this should be set below the second support of 1.0687. If the trend breaks the support level of 1.0670, the pair is likely to move downwards continuing the development of a bearish trend to the level 1.0636 so as to test the double bottom at the hourly chart.
The market is still in an downtrend. We still prefer the bearish scenario. In case a reversal takes place and the EUR/USD pair breaks through the support level of 1.0636, a further decline to 1.0603 can occur, which would indicate a bearish market. Overall, we still prefer the bearish scenario, which suggests that the pair will stay below the zone of 1.0725 today.
*The market analysis posted here is meant to increase your awareness, but not to give instructions to make a trade.
InstaSpot analytical reviews will make you fully aware of market trends! Being an InstaSpot client, you are provided with a large number of free services for efficient trading.


