


The legend in the InstaSpot team!
Legend! You think that's bombastic rhetoric? But how should we call a man, who became the first Asian to win the junior world chess championship at 18 and who became the first Indian Grandmaster at 19? That was the start of a hard path to the World Champion title for Viswanathan Anand, the man who became a part of history of chess forever. Now one more legend in the InstaSpot team!


Borussia is one of the most titled football clubs in Germany, which has repeatedly proved to fans: the spirit of competition and leadership will certainly lead to success. Trade in the same way that sports professionals play the game: confidently and actively. Keep a "pass" from Borussia FC and be in the lead with InstaSpot!

Overview :
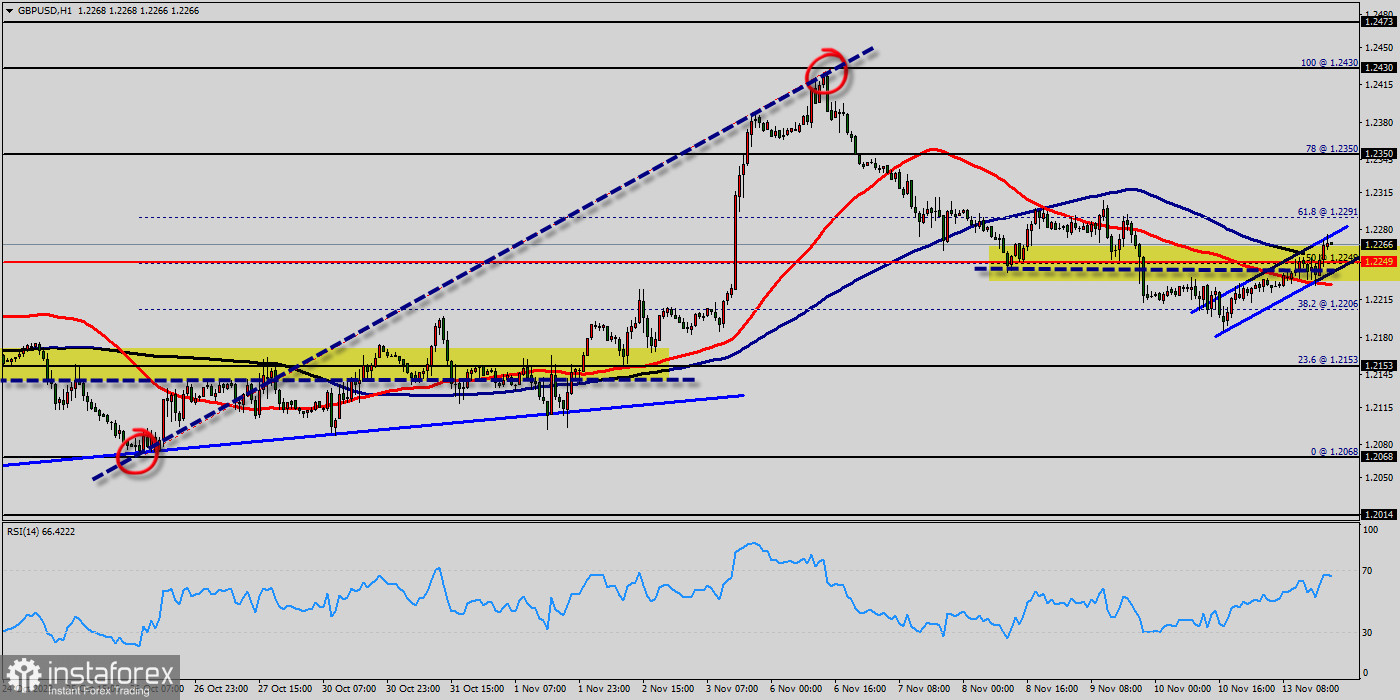
The GBP/USD pair traded in different directions in the range of 1.2206 - 1.2350 and closed the day without significant changes. Today the pair also traded in a narrow range of 1.2240-1.2200, remaining close to Friday's closing price.
On the hourly chart, the GBP/USD pair is still testing the strength of the support - the moving average line MA (100) H1 (1.2249). The situation is similar on the four-hour chart. Based on the above, it is probably worth sticking to the north direction in trading and while the pair remains above MA 100 H1, may be you need to look for entry points to buy at the end of the correction.
From a technical point of view, the GBP/USD pair holds on the winning side, according to the daily chart. The pair develops well above a bullish 50 Simple Moving Average (SMA), currently providing dynamic support at around 1.2153.
The 50 and 100 SMAs offer modest downward slopes, converging around the 1.2249 price zone. Finally, the Momentum indicator aims north, firmly bouncing from its midline, while the Relative Strength Index (RSI) indicator consolidates around 66.
The GBP/USD pair has faced strong support at the level of 1.2153 because resistance became support. So, the strong support has been already faced at the level of 1.2153 and the pair is likely to try to approach it in order to test it again.
The level of 1.2249 represents a weekly pivot point for that it is acting as minor support this week. Furthermore, the GBP/USD pair is continuing to trade in a bullish trend from the new support level of 1.2153.
Currently, the price is in a bullish channel. According to the previous events, we expect the GBP/USD pair to move between 1.2153 and 1.2350. Also, it should be noticed that the double top is set at 1.2430. Additionally, the RSI is still signaling that the trend is upward as it remains strong above the moving average (100).
This suggests the pair will probably go up in coming hours. Accordingly, the market is likely to show signs of a bullish trend. In other words, buy orders are recommended above 1.2249 with the first target at the level of 1.2350. If the trend is be able to break the double top at the level of 1.2350, then the market will continue rising towards the weekly resistance 1 at 1.2430 so as to test the ast bullish wave.
*The market analysis posted here is meant to increase your awareness, but not to give instructions to make a trade.
InstaSpot analytical reviews will make you fully aware of market trends! Being an InstaSpot client, you are provided with a large number of free services for efficient trading.


