


The legend in the InstaSpot team!
Legend! You think that's bombastic rhetoric? But how should we call a man, who became the first Asian to win the junior world chess championship at 18 and who became the first Indian Grandmaster at 19? That was the start of a hard path to the World Champion title for Viswanathan Anand, the man who became a part of history of chess forever. Now one more legend in the InstaSpot team!


Borussia is one of the most titled football clubs in Germany, which has repeatedly proved to fans: the spirit of competition and leadership will certainly lead to success. Trade in the same way that sports professionals play the game: confidently and actively. Keep a "pass" from Borussia FC and be in the lead with InstaSpot!

Overview :
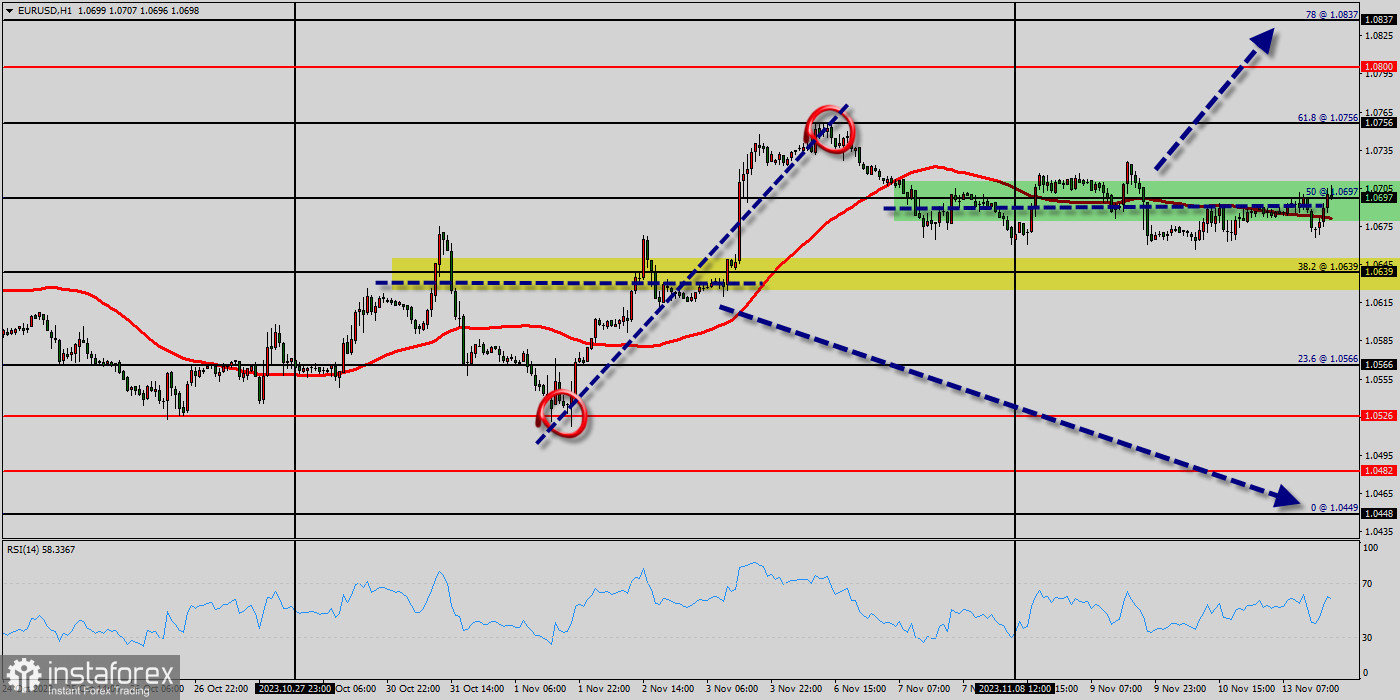
The EUR/USD pair has broken through the ceiling of a falling trend channel in the medium long term. This indicates a slower falling rate initially, or the start of a more horizontal development. The currency has support at points 1.0639 and resistance at points 1.0756.
The EUR/USD pair traded higher and closed the day in the positive territory around the price of 1.0700. Today the pair was trading in a narrow range of 1.0630 - 1.0756, remaining close to Monday's closing price.
On the hourly chart, the EUR/USD pair is still testing the strength of the support - the moving average line MA (100) H1 (1.0639). On the four-hour chart, the pair still remains above the MA 200 H4 line. Based on the above, it is probably worth sticking to the north direction in trading and while the pair remains above the MA 200 H1, may be you need to look for entry points to buy when a correction is formed.
Despite the somewhat dovish stance of Fed members causing a surge in risk assets last week, the US dollar index also experienced a partial uptick, reaching a peak near 100. After facing resistance at this level, the greenback stalled as investors switched to a cautious stance ahead of the upcoming US inflation data release.
The EUR/USD pair bottomed at 1.0526 and then reversed to the upside, driven by a weaker US Dollar. The pair is approaching 1.0697 and has moved back into positive territory for the day, in a relatively calm trading session. Market participants are awaiting Eurozone growth and employment data and US CPI figures, which are due on Monday.
Probably, the main scenario is a resumption of growth to 1.0700 (Nov 13 high). Thee alternative scenario involves consolidation below MA 100 H1, followed by a decline to 1.0526 (low).
Price actions from the level of 1.0639 are viewed as a corrective pattern to rise from 1.0639. Rise from the price of 1.0639 is tentatively seen as the second leg. Hence while further rally could be seen, upside should be limited by 1.0700 to bring the third leg of the pattern. However, break of 1.0697 will resume the fall to 50% retracement of 1.0756 to 1.0800 at 1.0837.
*The market analysis posted here is meant to increase your awareness, but not to give instructions to make a trade.
InstaSpot analytical reviews will make you fully aware of market trends! Being an InstaSpot client, you are provided with a large number of free services for efficient trading.


