


The legend in the InstaSpot team!
Legend! You think that's bombastic rhetoric? But how should we call a man, who became the first Asian to win the junior world chess championship at 18 and who became the first Indian Grandmaster at 19? That was the start of a hard path to the World Champion title for Viswanathan Anand, the man who became a part of history of chess forever. Now one more legend in the InstaSpot team!


Borussia is one of the most titled football clubs in Germany, which has repeatedly proved to fans: the spirit of competition and leadership will certainly lead to success. Trade in the same way that sports professionals play the game: confidently and actively. Keep a "pass" from Borussia FC and be in the lead with InstaSpot!

There were no significant events in the macroeconomic calendar, as it was a holiday in Europe, the United Kingdom, and the United States. This led to a decrease in trading volumes, which had a negative impact on market volatility.
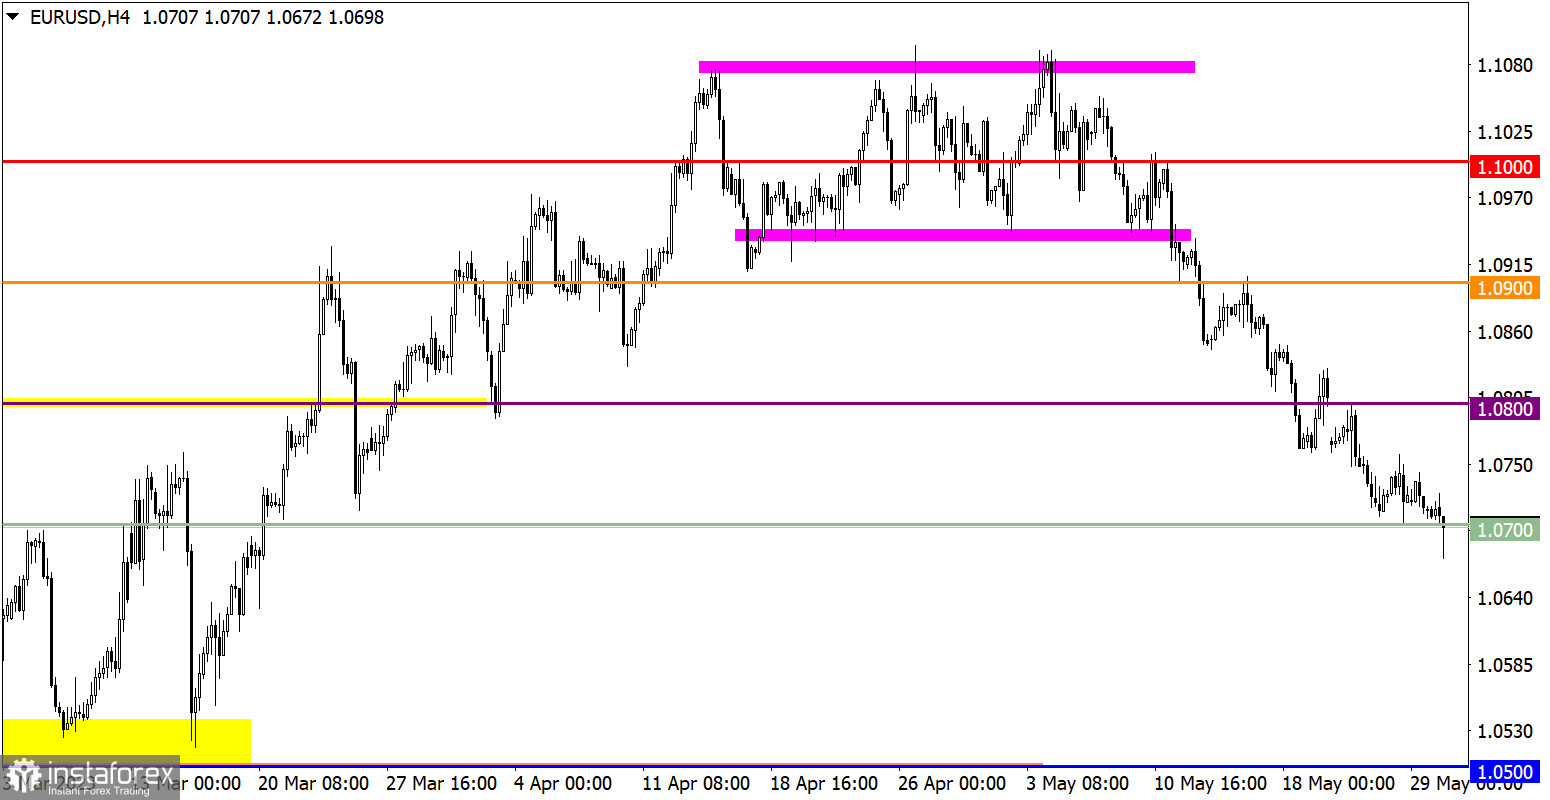
EUR/USD continued to decline after a brief stagnation. Keeping the price below the 1.0700 level became a technical signal for an increase in short positions on the euro, leading to local speculation.
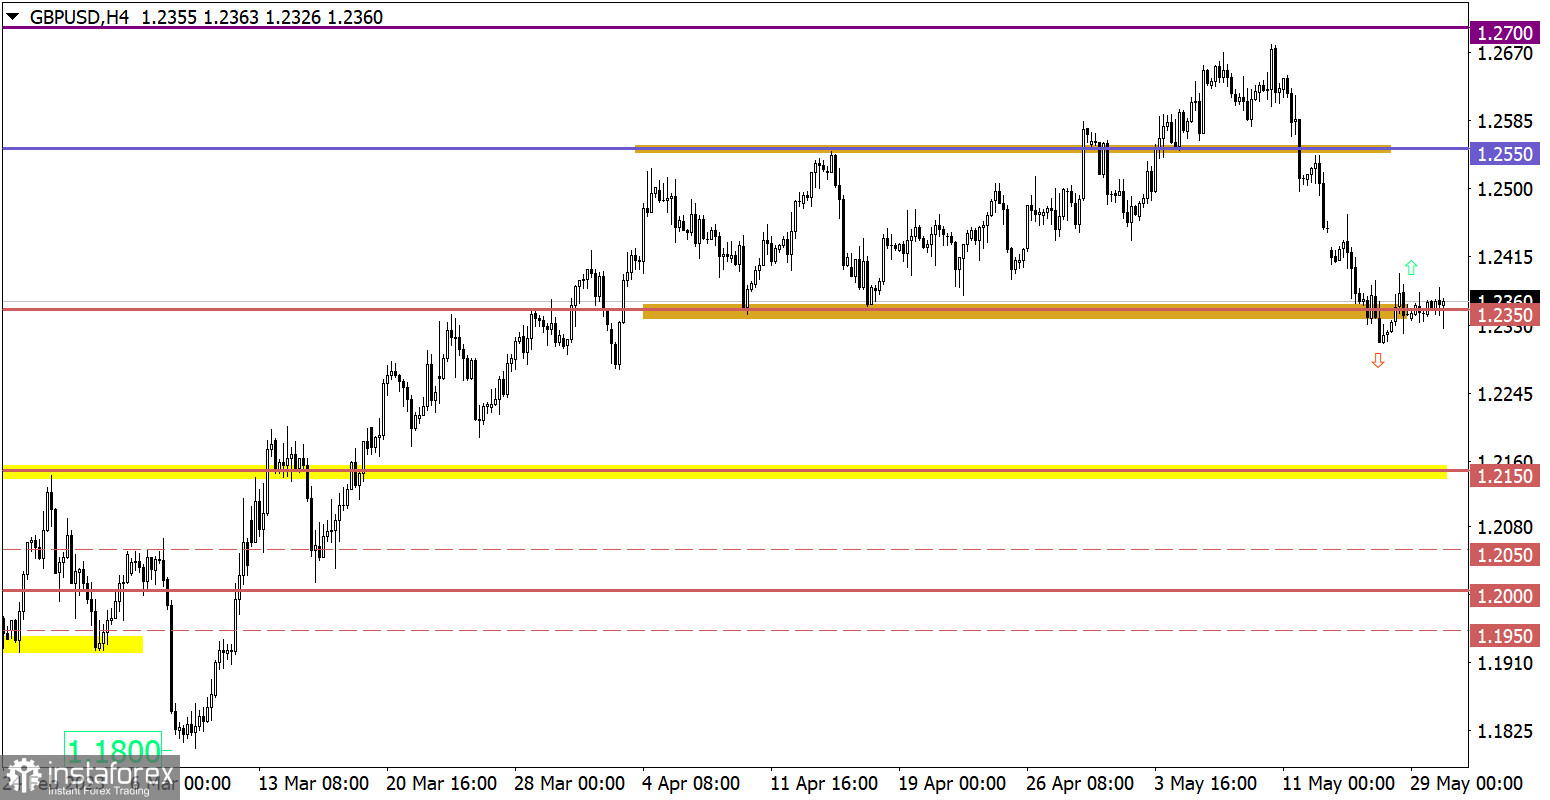
GBP/USD temporarily stalled around the 1.2350 level, largely due to the non-working day in the United Kingdom and the United States.
Today, the publication of the S&P/Case-Shiller Home Price Index Composite-20 in the United States is expected, and forecasts indicate a decline. If the negative forecast is confirmed, it could trigger a reduction in dollar positions, which are currently overbought.
In the current situation, there is a momentum-speculative movement, which has led to the continuation of the corrective cycle. If market participants continue to ignore the technical signal of oversold euro, the exchange rate may continue to decline and reach a support level around 1.0500/1.0550.
However, such speculative scenarios are often accompanied by a rebound. Therefore, a sharp reduction in short positions is possible, which will temporarily strengthen the euro's exchange rate.
Market participants still maintain a bearish sentiment, but to confirm the prolongation of the corrective cycle, the exchange rate must remain below the 1.2300 level. Otherwise, we may observe significant fluctuations around the 1.2350 level.
The candlestick chart type is white and black graphic rectangles with lines above and below. With a detailed analysis of each individual candle, you can see its characteristics relative to a particular time frame: opening price, closing price, intraday high and low.
Horizontal levels are price coordinates, relative to which a price may stop or reverse its trajectory. In the market, these levels are called support and resistance.
Circles and rectangles are highlighted examples where the price reversed in history. This color highlighting indicates horizontal lines that may put pressure on the asset's price in the future.
The up/down arrows are landmarks of the possible price direction in the future.
*The market analysis posted here is meant to increase your awareness, but not to give instructions to make a trade.
InstaSpot analytical reviews will make you fully aware of market trends! Being an InstaSpot client, you are provided with a large number of free services for efficient trading.


