


The legend in the InstaSpot team!
Legend! You think that's bombastic rhetoric? But how should we call a man, who became the first Asian to win the junior world chess championship at 18 and who became the first Indian Grandmaster at 19? That was the start of a hard path to the World Champion title for Viswanathan Anand, the man who became a part of history of chess forever. Now one more legend in the InstaSpot team!


Borussia is one of the most titled football clubs in Germany, which has repeatedly proved to fans: the spirit of competition and leadership will certainly lead to success. Trade in the same way that sports professionals play the game: confidently and actively. Keep a "pass" from Borussia FC and be in the lead with InstaSpot!

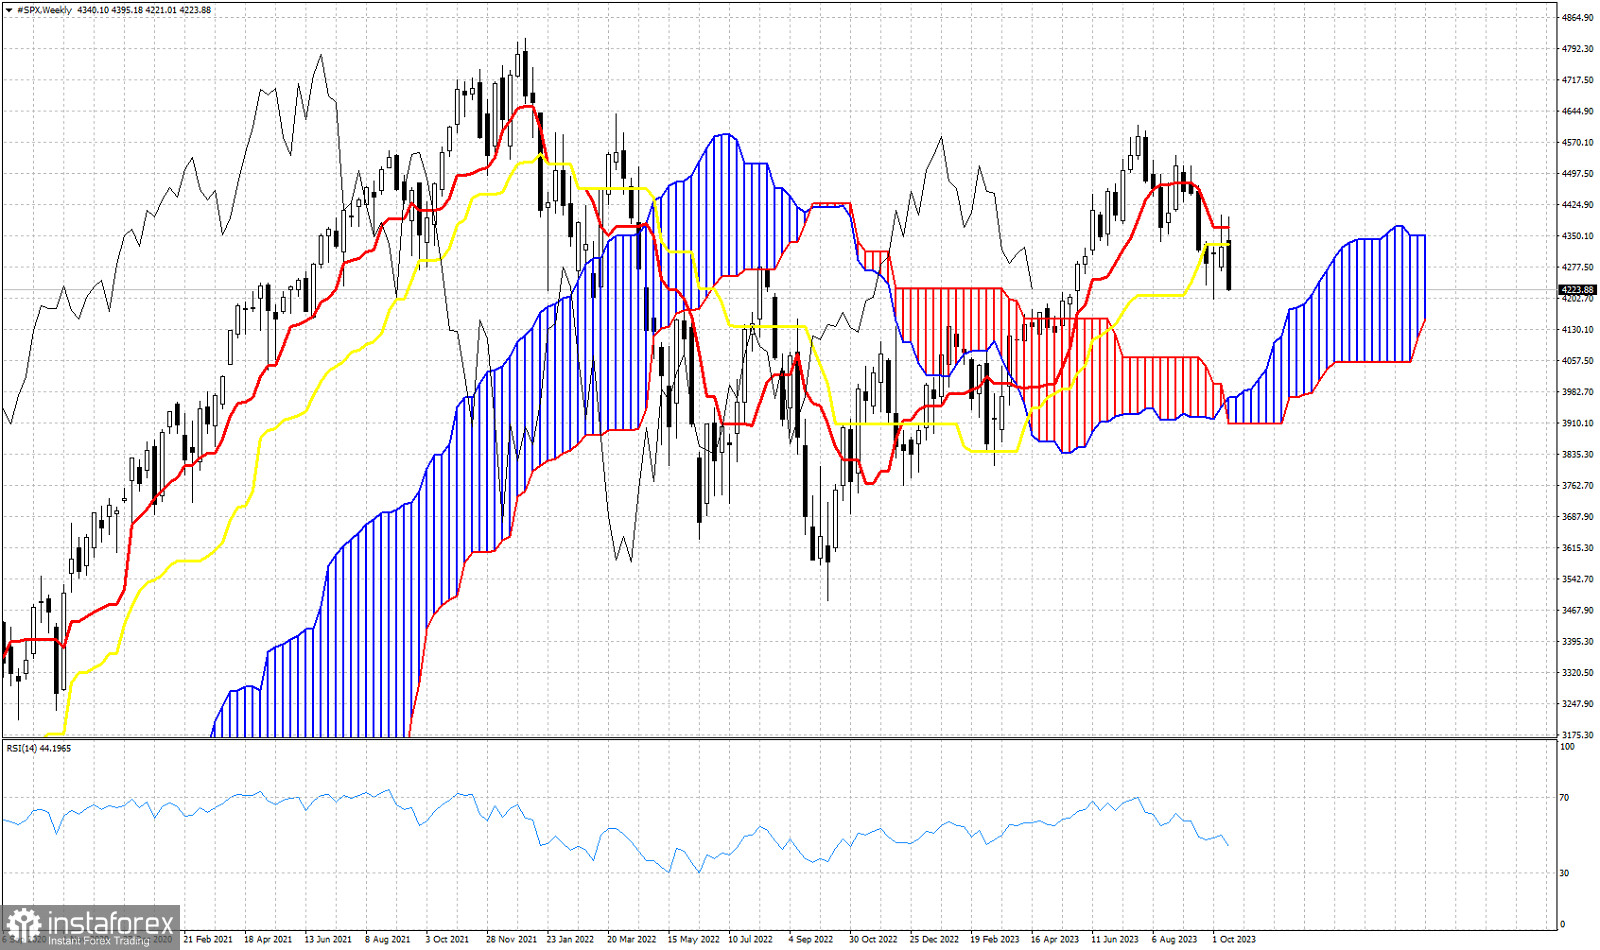
In a previous analysis we used the Ichimoku cloud indicator in the Daily chart to analyse its current market profile. As we mentioned in our analysis, trend was bearish because price was below the Kumo (cloud) and the index was vulnerable to a move lower. The week ended with SPX making new lows as expected. The index closed at new lower lows since June. Today we check the Ichimoku cloud indicator in the weekly chart. The last two weeks bulls tried to push price above the tenkan-sen (red line indicator) but price got rejected. Recent price action confirms the importance of the resistance area of 4,330-,4370 where we also find the kijun-sen (yellow line indicator). The Chikou span (black line indicator) is above the candlestick pattern (bullish) but with a negative slope. Trend on a weekly basis is bullish because price is above the Kumo, but with price breaking below both the tenkan-sen and kijun-sen, we conclude that the index is vulnerable to a move lower towards the weekly Kumo (cloud) support around 4,000-4,050.
*The market analysis posted here is meant to increase your awareness, but not to give instructions to make a trade.
InstaSpot analytical reviews will make you fully aware of market trends! Being an InstaSpot client, you are provided with a large number of free services for efficient trading.


