


Our team has over 7,000,000 traders!
Every day we work together to improve trading. We get high results and move forward.
Recognition by millions of traders all over the world is the best appreciation of our work! You made your choice and we will do everything it takes to meet your expectations!
We are a great team together!
InstaSpot. Proud to work for you!


Actor, UFC 6 tournament champion and a true hero!
The man who made himself. The man that goes our way.
The secret behind Taktarov's success is constant movement towards the goal.
Reveal all the sides of your talent!
Discover, try, fail - but never stop!
InstaSpot. Your success story starts here!

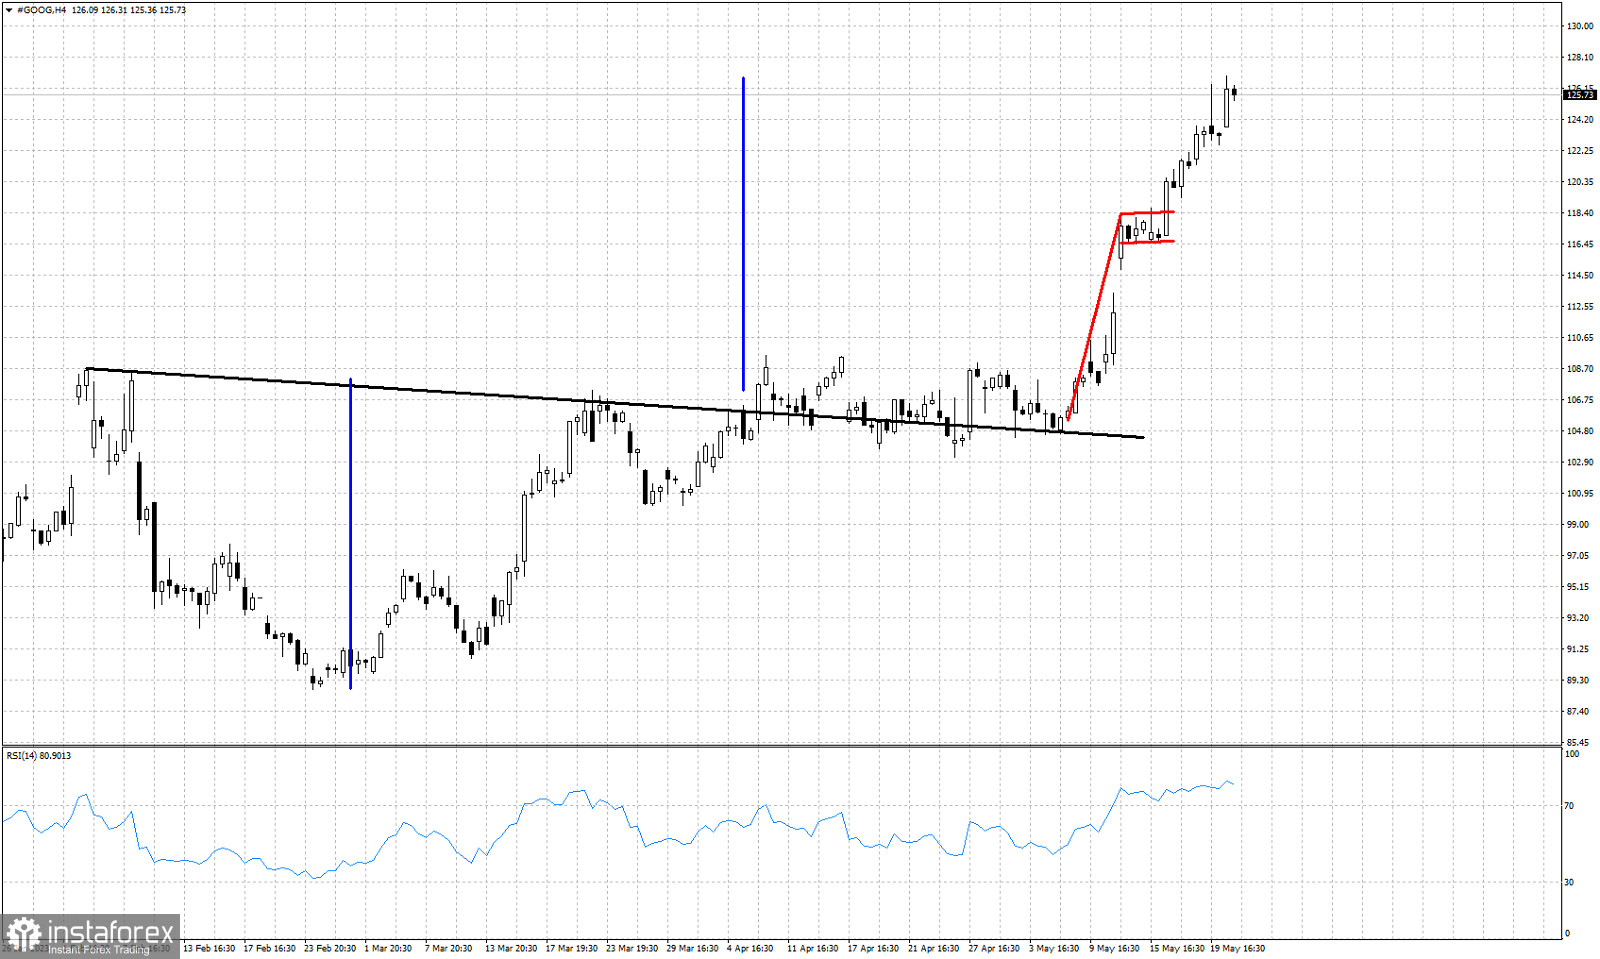
Blue lines- expected rise equal to height of cup
Red lines- bullish flag
The cup and handle pattern we identified in April for the GOOG stock has now fulfilled its first target of $127. Yesterday price reached $126.93 and remains in a short-term bullish trend making higher highs and higher lows. The bullish flag pattern target is at $130 and the momentum favors reaching this target as well. The RSI has reached overbought levels. A pull back at current levels is justified. Traders better protect their gains as the chances of a pull back have increased. Support is found at the flag area of $119-$117. It would not be a good sign if price breaks below this level. We remain bullish as long as we hold above it.
*The market analysis posted here is meant to increase your awareness, but not to give instructions to make a trade.
InstaSpot analytical reviews will make you fully aware of market trends! Being an InstaSpot client, you are provided with a large number of free services for efficient trading.


