


Our team has over 7,000,000 traders!
Every day we work together to improve trading. We get high results and move forward.
Recognition by millions of traders all over the world is the best appreciation of our work! You made your choice and we will do everything it takes to meet your expectations!
We are a great team together!
InstaSpot. Proud to work for you!


Actor, UFC 6 tournament champion and a true hero!
The man who made himself. The man that goes our way.
The secret behind Taktarov's success is constant movement towards the goal.
Reveal all the sides of your talent!
Discover, try, fail - but never stop!
InstaSpot. Your success story starts here!

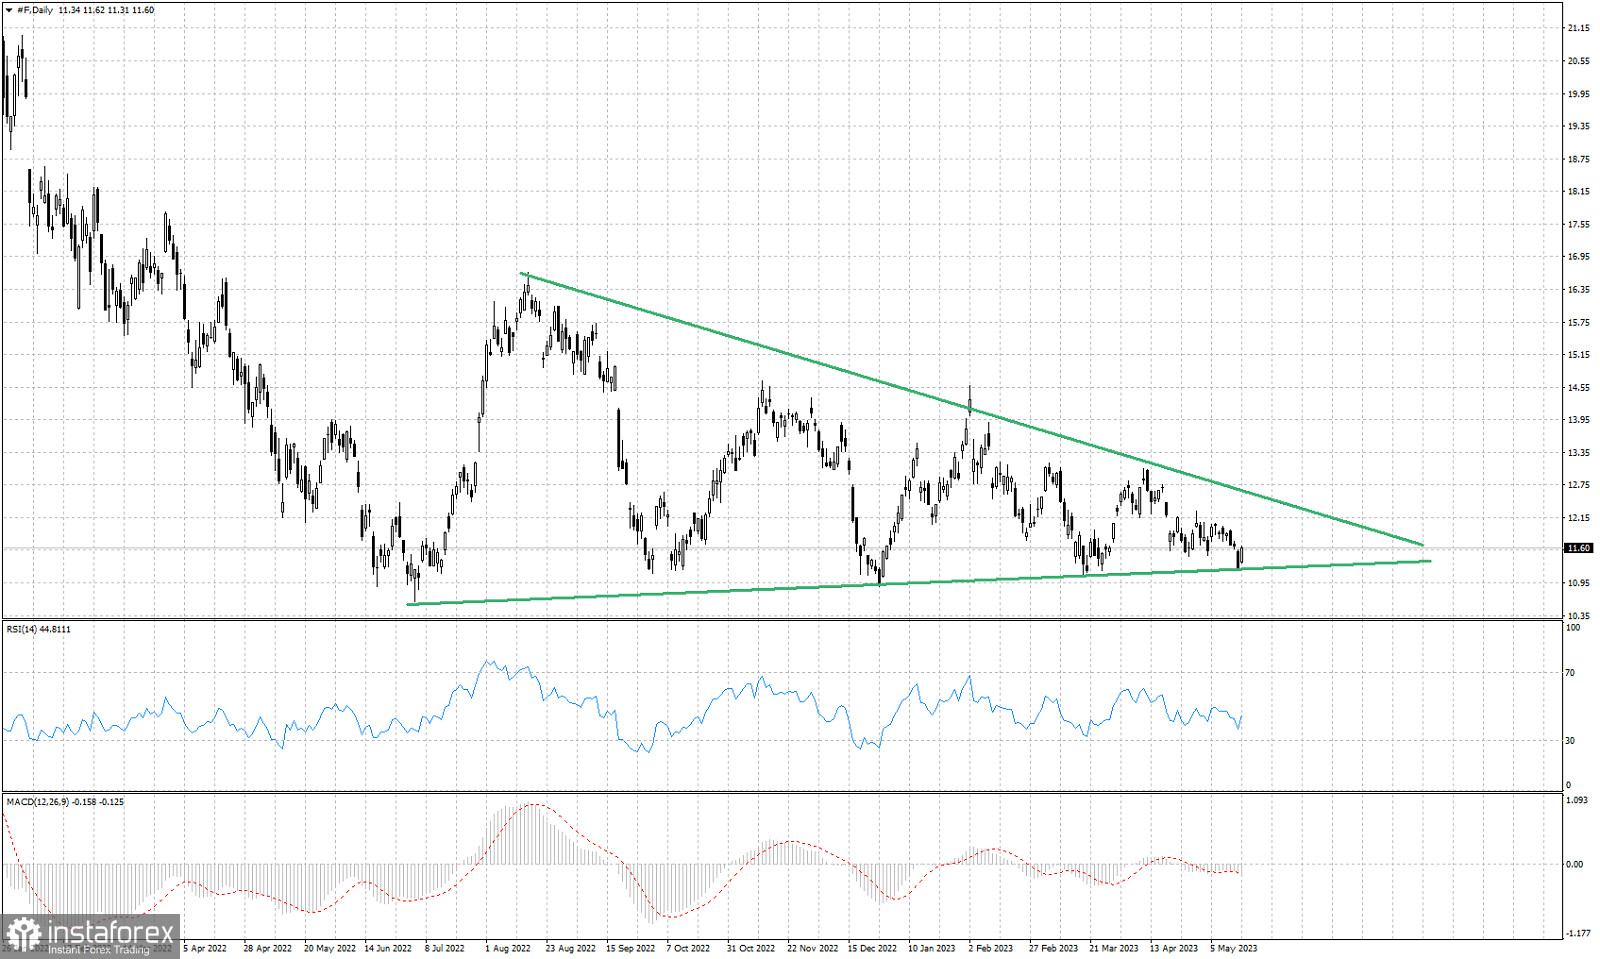
Green lines- triangle pattern
Following our analysis on Ford stock price from May 8th, we see that the stock price is challenging the lower triangle support boundary of the triangle pattern it is in. Today price is bouncing off the triangle boundary confirming the importance of the support at $11.20. Short-term trend is bearish as price is making lower lows and lower highs for the last 40 days. There are increased chances of a bounce and short-term trend reversal from current levels. Support at $11.20 is key. Bulls need to defend it. Price justifies a bounce towards the upper triangle boundary at $12.55. Traders need to be cautious in case the triangle boundary is broken.
*The market analysis posted here is meant to increase your awareness, but not to give instructions to make a trade.
InstaSpot analytical reviews will make you fully aware of market trends! Being an InstaSpot client, you are provided with a large number of free services for efficient trading.


