


Our team has over 7,000,000 traders!
Every day we work together to improve trading. We get high results and move forward.
Recognition by millions of traders all over the world is the best appreciation of our work! You made your choice and we will do everything it takes to meet your expectations!
We are a great team together!
InstaSpot. Proud to work for you!


Actor, UFC 6 tournament champion and a true hero!
The man who made himself. The man that goes our way.
The secret behind Taktarov's success is constant movement towards the goal.
Reveal all the sides of your talent!
Discover, try, fail - but never stop!
InstaSpot. Your success story starts here!

It's been exactly three weeks since my last precious metals outlook review article "Gold is a long road to profit" and I have some regret to report that all of the $1750 and $1700 downside targets stated there have been met and even exceeded. "Why with regret?", you ask. Because I am a gold bull by nature and prefer to buy gold rather than sell it, even if I have to do it in the short term.
However, you will not be fed up with the old merits, and we need to re-examine the prospects for precious metals in the context of changed data in order to determine further directions for short-term and medium-term deals. First of all, looking from today, it should be noted that the decline in gold has not yet been completed.
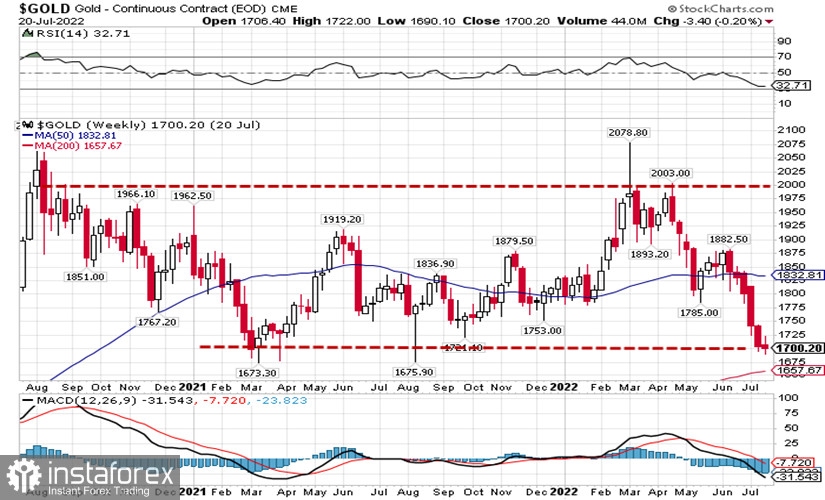
Fig.1: Technical picture of gold, weekly time
The price reduction in June-July 2022 was very rapid. In two months, gold has lost a tenth of its value, and this dynamics is very similar to the price drop in January-March 2021. Then gold managed to hold on to the support of $1,700, but whether it will be able to stop at this level now is still unknown (Fig. 1).
It is possible that support will hold this time, but in order to understand the chances of gold to stay afloat, let's compare the outflow and inflow of the precious metal from exchange traded funds then and now. And also let's see how the futures positions of gold traders on the CME exchange behave, since their analysis is available to us using the COT Report on the obligations of traders.
My deep conviction, based on many years of observations, is that in the medium term, gold reacts to the greatest extent precisely on the behavior of American investors and speculators. Therefore, first of all, we will consider and compare the inflow and outflow of gold in North American exchange-traded funds, the so-called Gold ETF (Fig. 2).
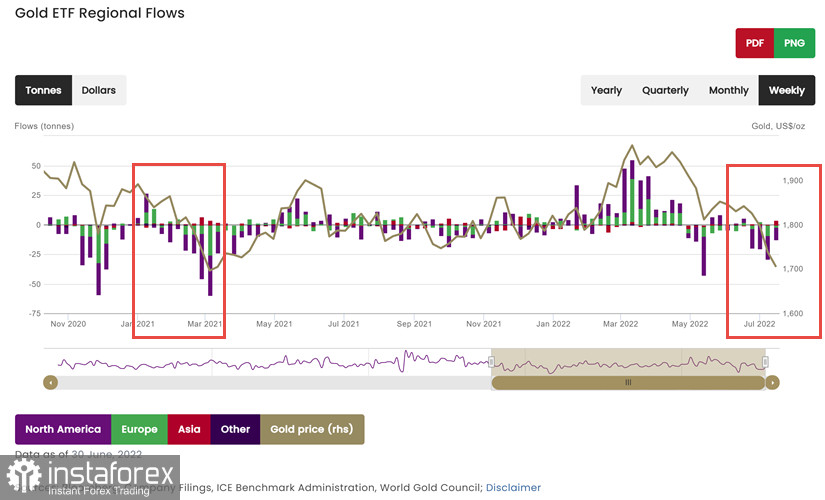
Figure 2: Outflows and inflows of gold in the Gold ETF
Even though the month is not yet over, it is clear that in the winter of 2021, the outflow from North American funds was much stronger than now. Then exchange trading funds lost 117 tons of gold, of which 102 tons flowed out of the United States. Now in June-July 2022, Gold ETFs lost 75 tons of gold, and the largest number of losses again fell on funds from the United States. The figures are comparable, and, perhaps, the figures for the remaining time will be equal, but at least we see that the current losses do not yet exceed the losses of the winter of 2021. It's already good.
Now let's consider the situation in the futures market, which is known to us thanks to the COT Report. The situation that we can observe now is significantly different from the parameters that it had last year (Fig. 3).
If we talk about supply and demand, displayed by the Open Interest indicator, then there are no special differences. Then and now OI is near the mark of 700,000 contracts, but the differences in the structure of traders' positions are very significant.
First of all, it is necessary to explain that the COT Report divides traders into net buyers and net sellers. Net buyers include traders of the Managed Money groups, who are essentially speculators and Other Reportables (not shown in this diagram, because in this context the indicators can be neglected). Net sellers include Swap Dealer and Producer traders, who mainly hedge their risks in the futures market.
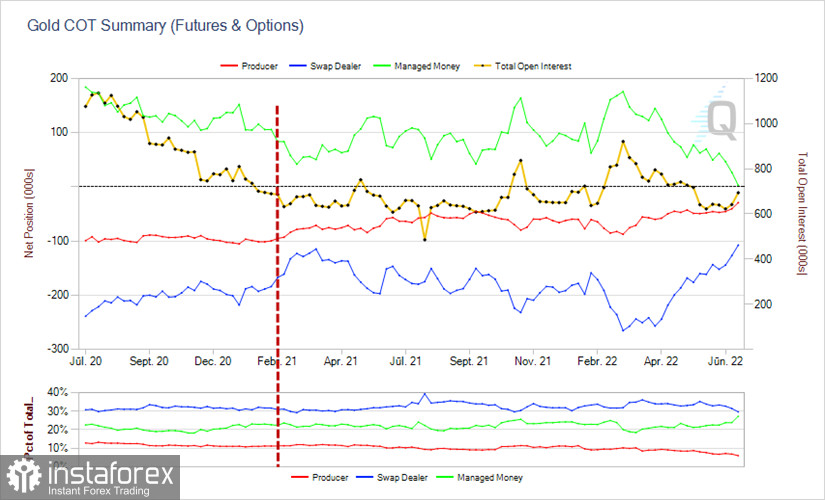
Figure 3: Data from the Commitments of Traders Report – COT Report
So, the difference of the situation lies in the fact that at that time, in the Open Interest indicator, Swap Dealer and Producer occupied 40% of supply, and speculators covered 24% of demand. Now Swap Dealer and Producer cover 36% of the supply, while the share of speculators in Open Interest has increased to 27.3%. At the same time, speculators, being net buyers, have zero total positions, i.e., they have actually become sellers. From which the conclusion follows that speculators want to capitalize on price declines and push prices down by opening short positions.
We could observe something similar in the spring and summer of 2018, when Managed Money speculators also opened a lot of short positions and, in aggregate, even went into negative territory, which led to a decrease in the price from $1400 to $1250, but then gold moved from October 2018 to July 2020 to growth and reached a historical high at $2,089 (Fig. 4).
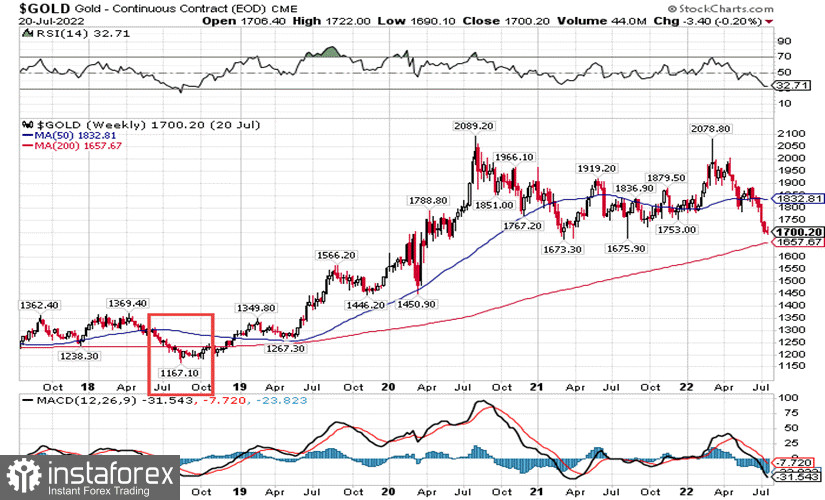
Fig.4: Gold price dynamics, weekly time
Naturally, any analogies should be accepted by us with certain reservations, especially considering that history always repeats itself with some variations. However, taking into account the current situation, it can be assumed that speculators' attempts to push gold down will continue. At the same time, the presence of gold at the level of two-year support limits traders in their attempts to open short positions, and the possibility of quickly closing shorts of speculators in the futures market can lead to a sharp increase in prices.
At the same time, gold purchases from current values will be clearly premature, since the price has not yet formed a reversal pattern that allows you to open long positions. In this regard, we now have no choice but to carefully observe the current situation, trying not to miss the implementation of a particular scenario.
On Thursday, after the meeting of the European Central Bank, which unexpectedly raised the refinancing rate by 50 basis points at once, to 0.5%, the price of gold rebounded from its lows. This was due to the decline of the dollar due to the appreciation of the European currency, as well as a new program to support the transfer of monetary policy from the ECB to specific countries. In fact, the ECB once again worsened the quality of the euro, announcing the possibility, if necessary, to buy defaulted debts of the eurozone countries, printing unsecured euros in unlimited quantities, once again undermining the pool of reserve currencies, but I will talk about this in more detail in the next article.
Be careful and cautious, follow the rules of money management!
*The market analysis posted here is meant to increase your awareness, but not to give instructions to make a trade.
InstaSpot analytical reviews will make you fully aware of market trends! Being an InstaSpot client, you are provided with a large number of free services for efficient trading.


